
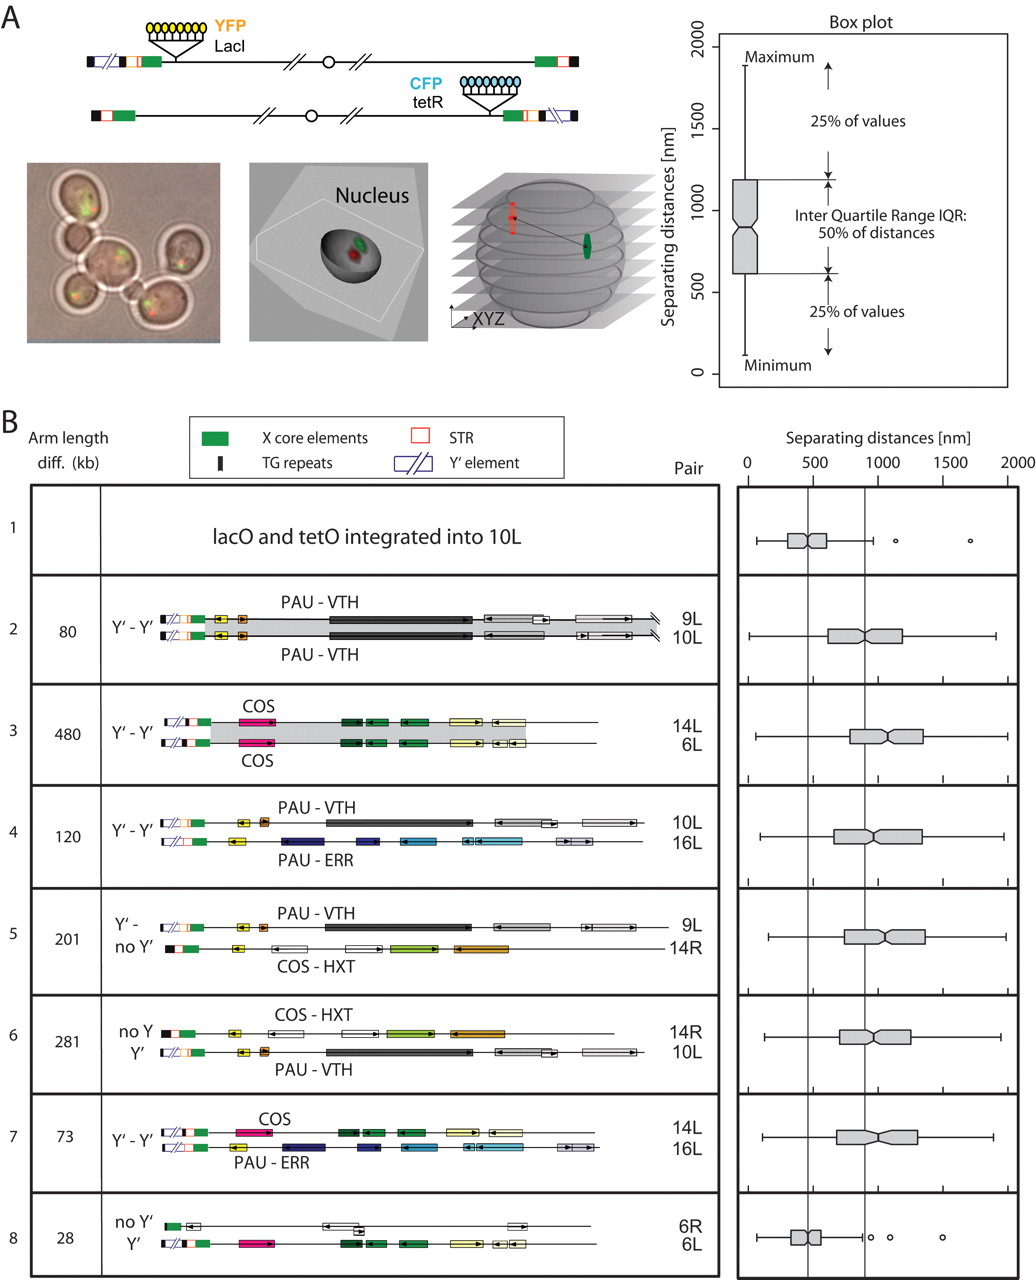
Extensive homology does not confer interaction in telomeric foci. (A) 3D image stacks were acquired at 0.2-μm spacing along the Z-axis of the indicated yeast strains having targeted integration of lacO and tetO arrays and expressing LacI-CFP and TetR-YFP. Image stacks were analyzed by the SpotDistance plug-in of ImageJ and are represented as a box plot. The notch around the median represents ±5%. Outliers are defined as 1.5 times the Inter Quartile Range (IQR) (open circles). (B) (Left panel) Sketch of various telomere pairs represented as lines with TG repeats (black box), Y′ elements (open blue box), STR elements (open red box), and X core elements (green) indicated to the left. The shading between telomeres indicates >90% identity. (Right panel) Distance distributions between the telomeres in the left panel represented as box plots. The strains and number of cells analyzed per pair are as follows: (panel 1) GA-2686, n = 282, pair: 10L–10L; (panel 2) GA-2685, n = 315, pair: 9L–10L; (panel 3) GA-2753, n = 331, pair 14L–6L; (panel 4) GA-2691, n = 437, pair: 10L–16L; (panel 5) GA-2687, n = 367, pair: 9L–14R; (panel 6) GA-3268, n = 286, pair: 14R–10L; (panel 7) GA-2731, n = 91 pair: 14L–16L; (panel 8) GA-958, n = 231, pair: 6L–6R.


