
Quantitative analysis of multiple sequence alignment strategies
Click on table to view larger version.
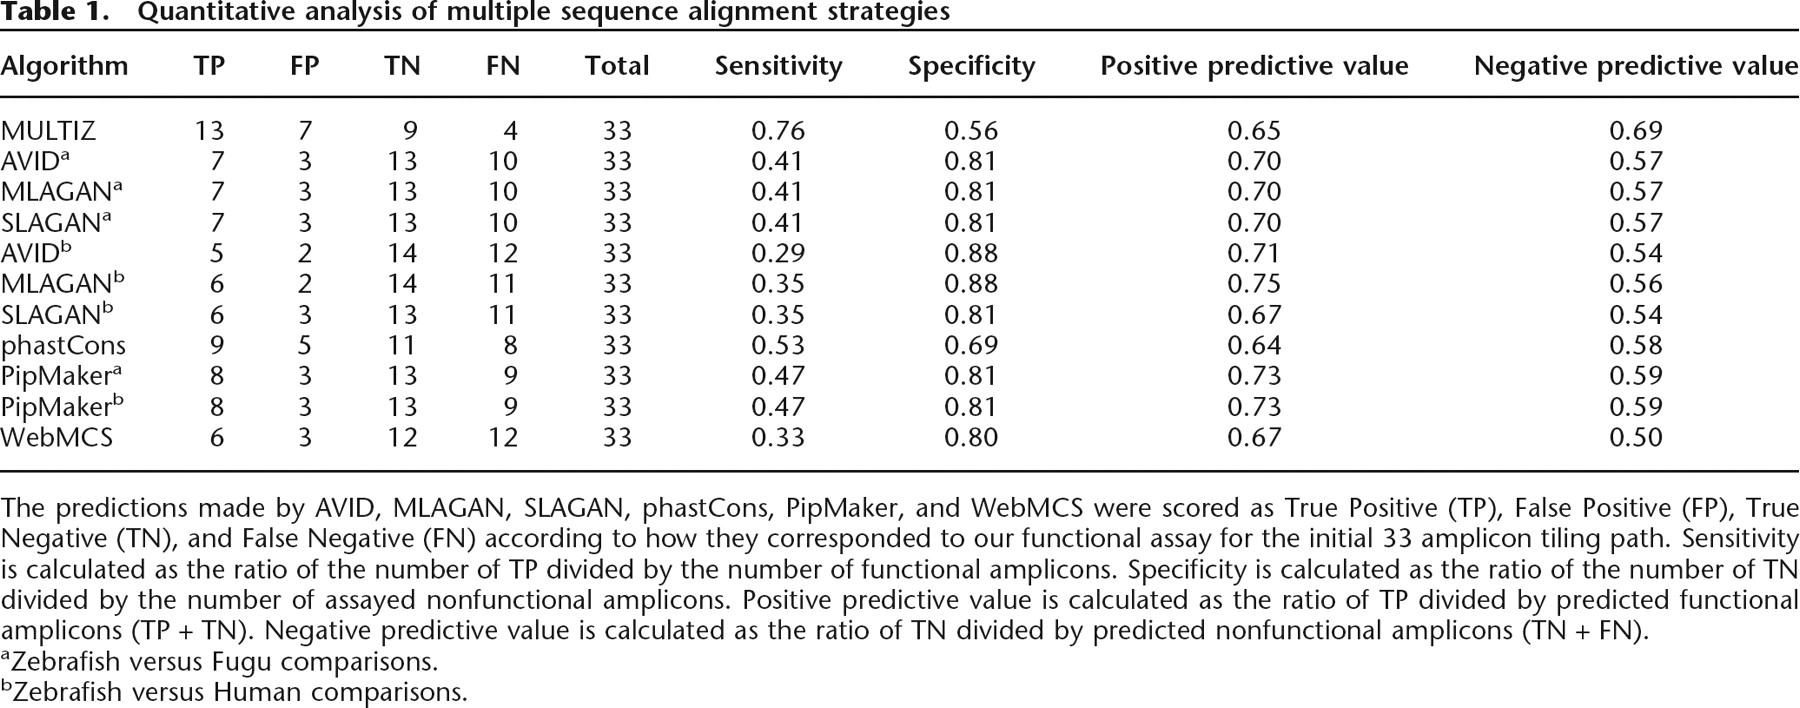
The predictions made by AVID, MLAGAN, SLAGAN, phastCons, PipMaker, and WebMCS were scored as True Positive (TP), False Positive (FP), True Negative (TN), and False Negative (FN) according to how they corresponded to our functional assay for the initial 33 amplicon tiling path. Sensitivity is calculated as the ratio of the number of TP divided by the number of functional amplicons. Specificity is calculated as the ratio of the number of TN divided by the number of assayed nonfunctional amplicons. Positive predictive value is calculated as the ratio of TP divided by predicted functional amplicons (TP + TN). Negative predictive value is calculated as the ratio of TN divided by predicted nonfunctional amplicons (TN + FN).
aZebrafish versus Fugu comparisons.
bZebrafish versus Human comparisons.


