
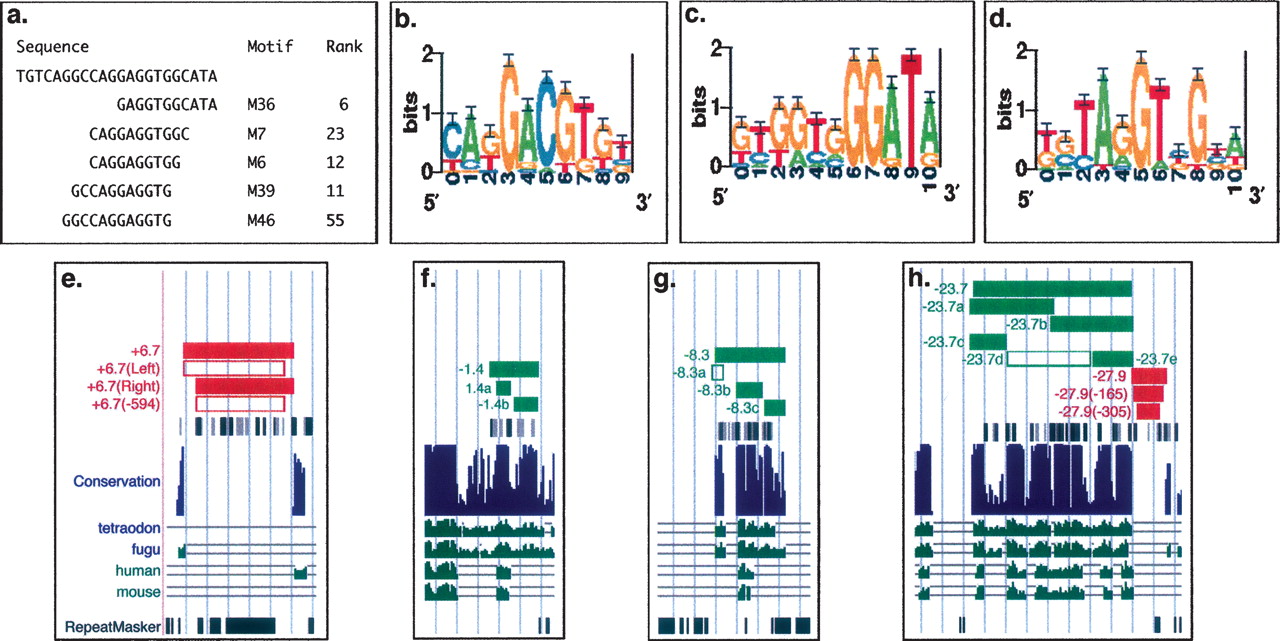
Functional dissection of biological activity in identified regulatory intervals. (a) Sequences with high predicted affinity to the identified motifs which discriminate functional from nonfunctional regions within the assayed phox2b interval and their rank order as identified in Supplemental Table S4. (b–d) Logos representing position weight matrices M6, M36, and M39, respectively. Regulatory amplicons ZNCS +6.7, ZCS −1.4, ZCS −8.3, ZCS −23.7, and ZNCS −27.9 were reduced in size and evaluated as component amplicons to determine the sequence origins of their observed activity (e–h). Boxes shaded red denote functional ZNCS and those shaded green denote functional ZCS; open boxes denote no observed activity.


