
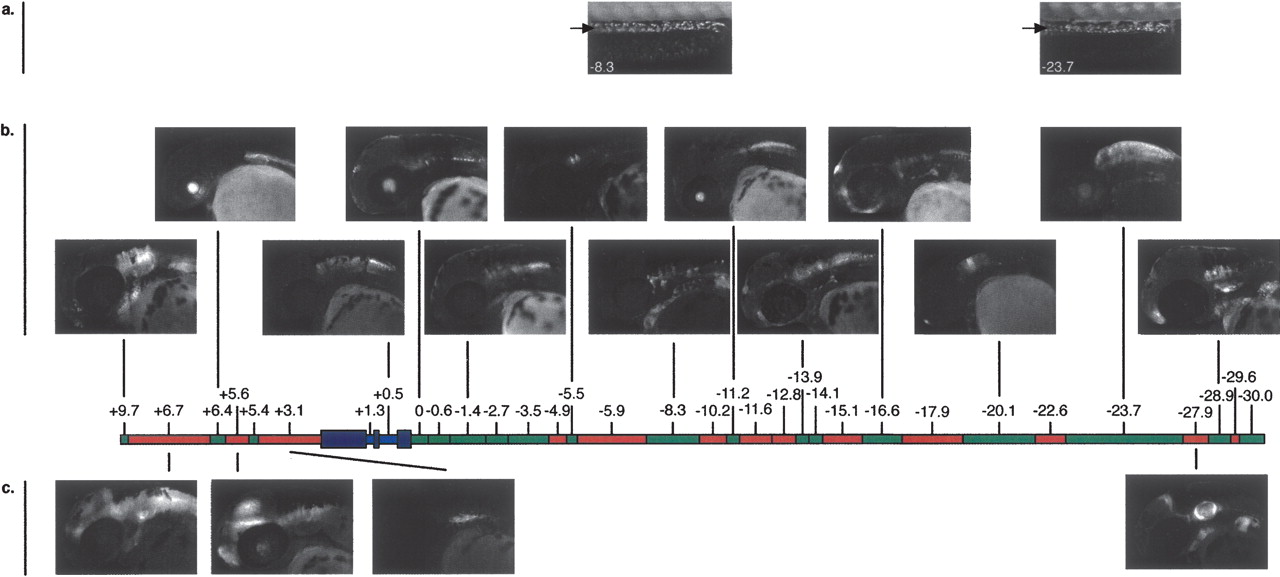
Figure 3.
Amplicons across the phox2b display significant functional overlap. The total interval assayed is depicted by color-coded rectangles: red (ZCS), green (ZNCS), purple (phox2b exons), and blue (phox2b introns). (a,b) Images corresponding to functional ZCS constructs. (a) 72-hpf zebrafish embryos with arrow marking ENS expression (ZCS −8.3 and ZCS −23.7). (b) Images indicating the range of hindbrain expression patterns driven by ZCS constructs. (c) Images indicating the range of hindbrain expression patterns driven by ZNCS constructs.


