
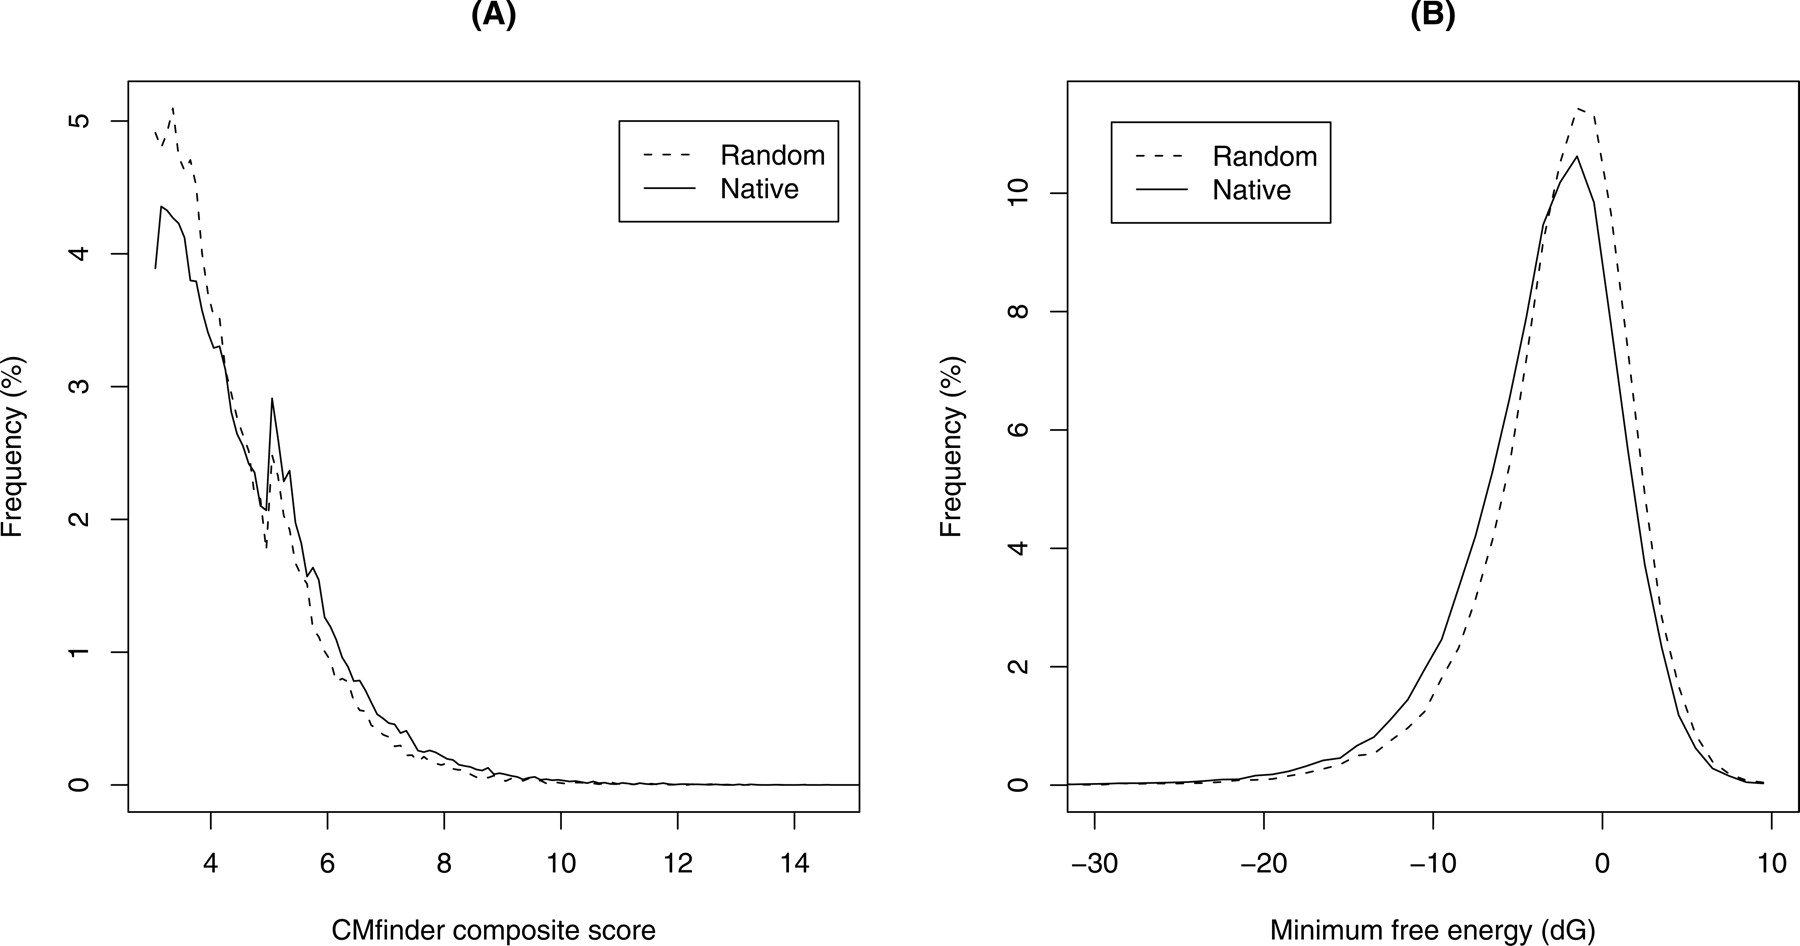
Figure 1.
Score distribution of the full CMfinder input set (A) composite score and (B) consensus minimum free energies for the native and random (shuffled) sequences. There is a slight shift toward lower energy and higher score for our native data.


