
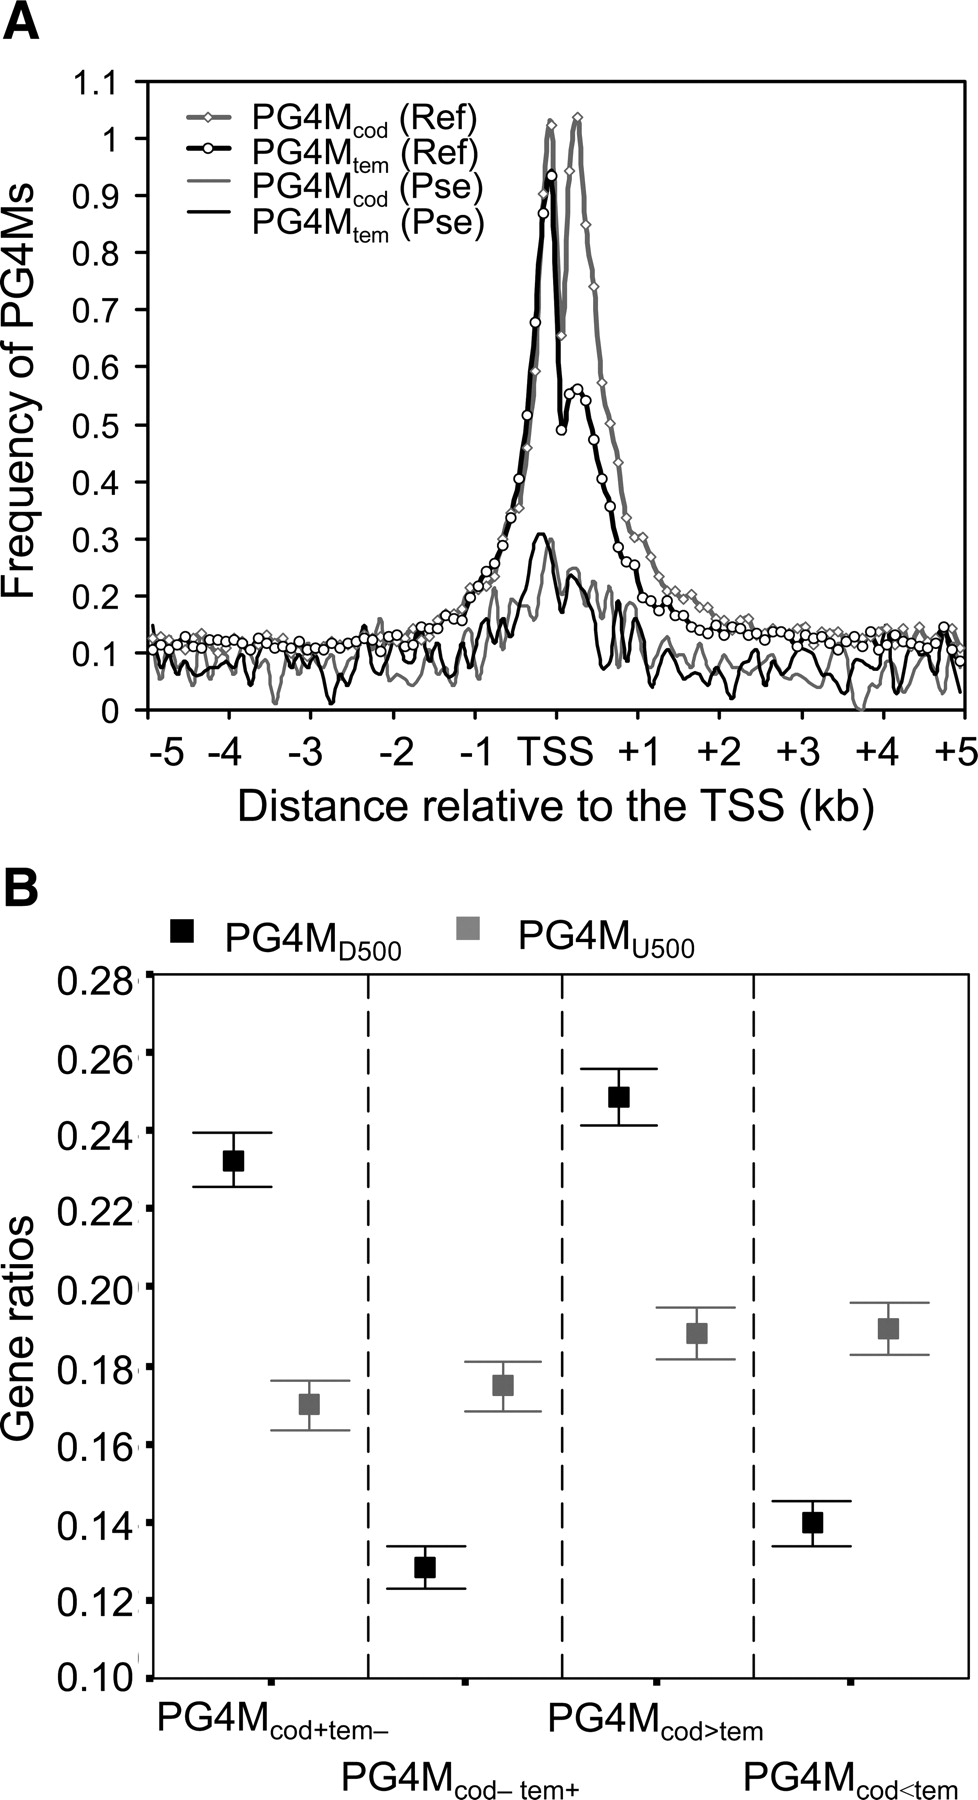
Figure 4.
Strand asymmetry of PG4MD500. (A) Comparison of the frequency between PG4Mcod (gray line) and PG4Mtem (black line) in the10-kb TSS-flanking region of human RefSeq genes (Ref) (n = 13,276) and pseudogenes (Pse) (n = 824). (B) Ratios of genes containing (1) PG4Mcod but not PG4Mtem (PG4Mcod+tem–); (2) PG4Mtem but not PG4Mcod (PG4Mcod–tem+); (3) more PG4Mcod than PG4Mtem (PG4Mcod>tem); and (4) fewer PG4Mcod than PG4Mtem (PG4Mcod<tem) in the D500 regions (black squares). The corresponding values for PG4MU500 are plotted as a control (gray squares).


