
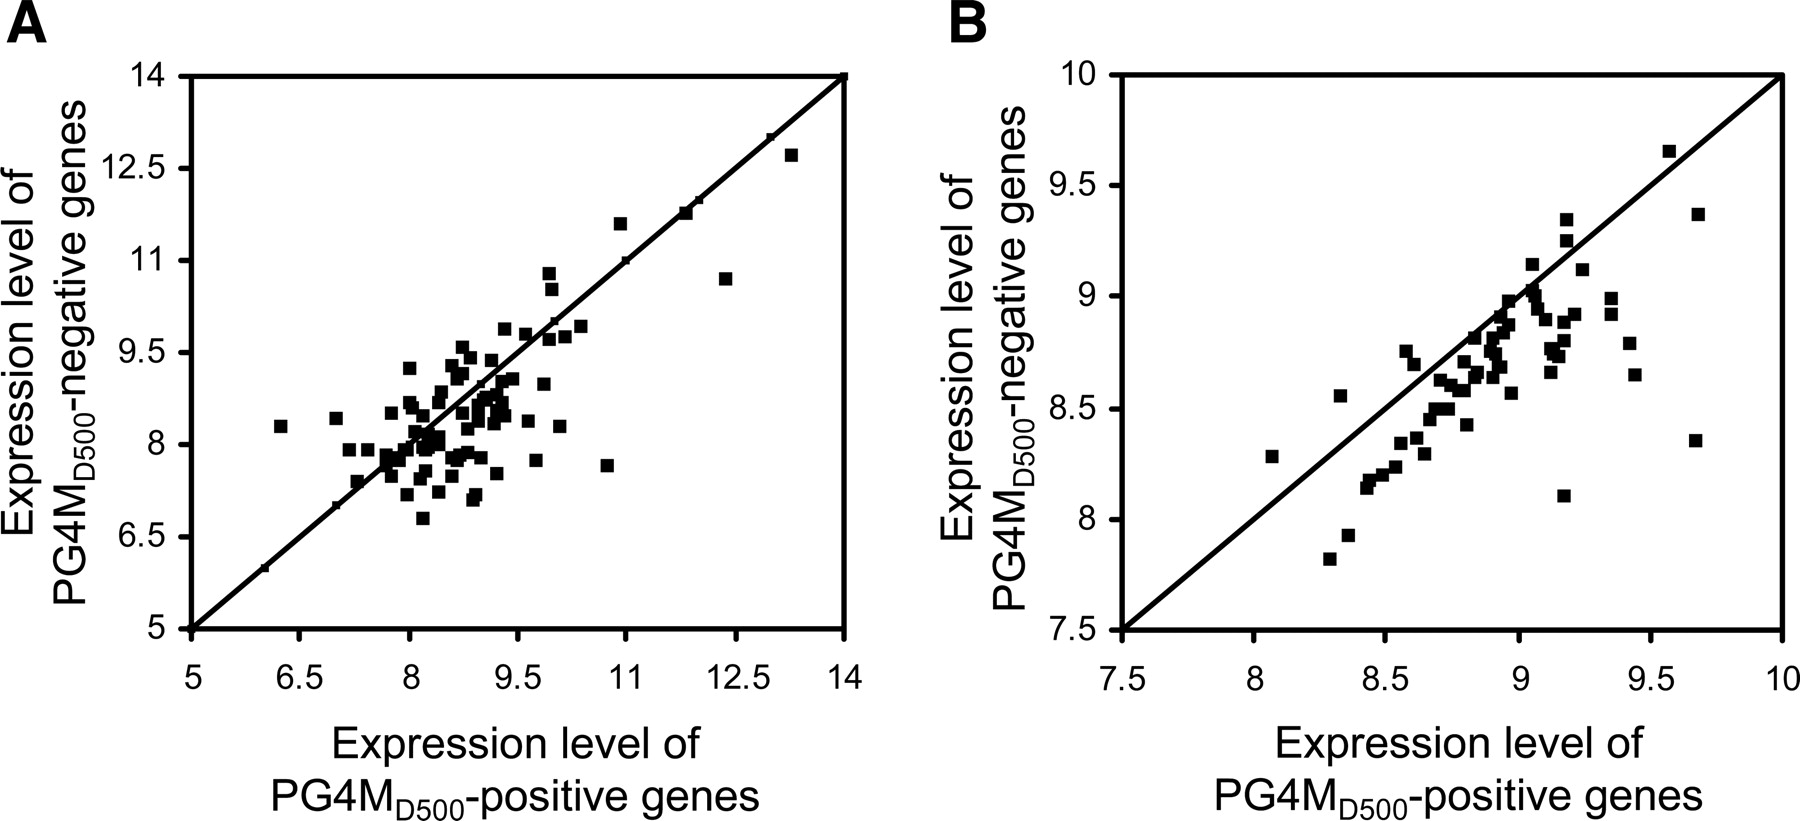
Figure 3.
Comparison of expression levels between PG4MD500-positive and PG4MD500-negative genes when gene family and function are controlled. Human genes are clustered according to gene family (A) and gene function (B), and mean expression levels are compared between PG4MD500-positive (X-axis) and PG4MD500-negative genes (Y-axis) in each cluster. The angle bisector represents equal expression levels. The squares below the angle bisector indicate that the expression level of PG4MD500-positive genes is higher than that of PG4MD500-negative genes, and vice versa.


