
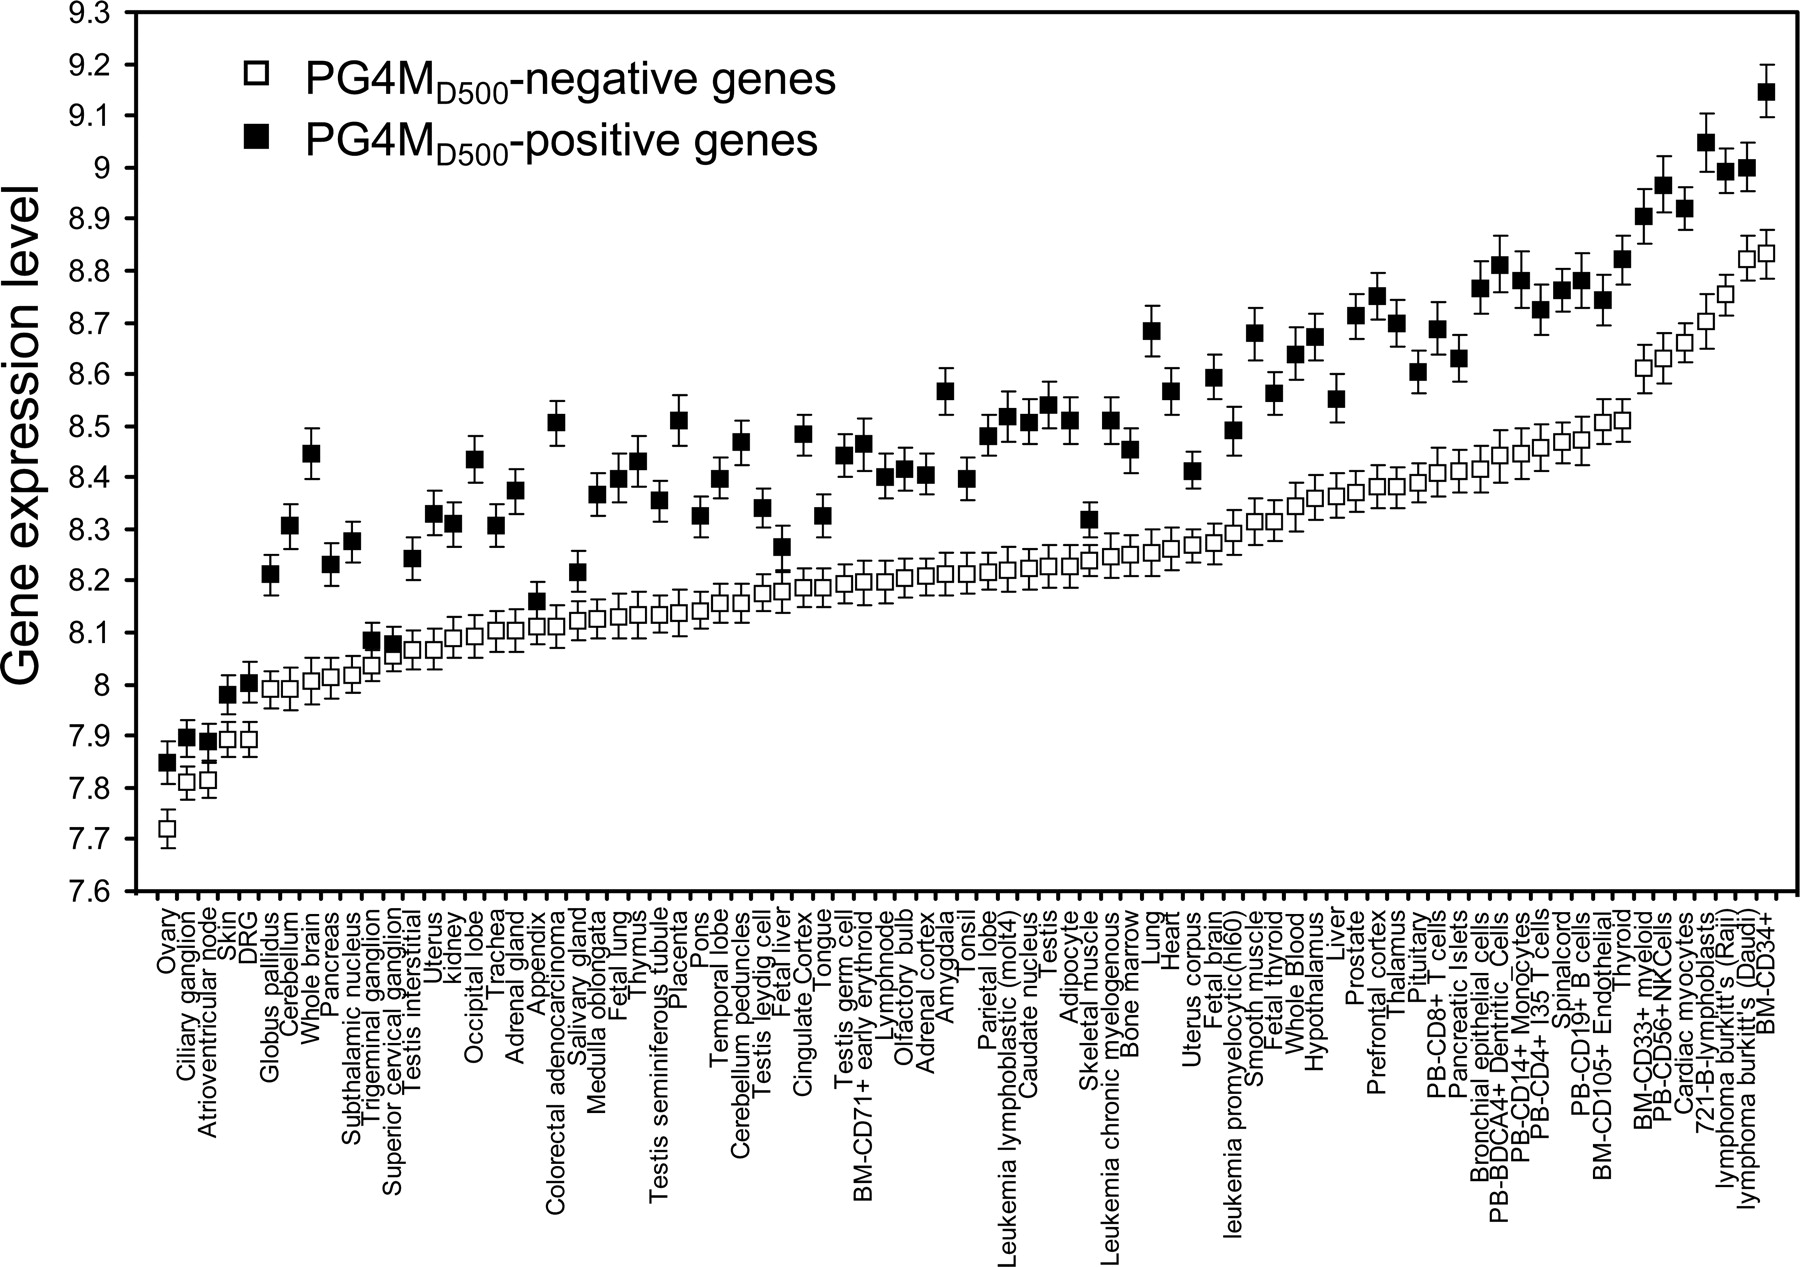
Figure 2.
Influence of PG4MD500 on gene expression for each tissue/cell. Comparison of the gene expression levels between PG4MD500-positive (black squares) and PG4MD500-negative genes (open squares) in each human tissue/cell type. Error bars represent the 95% confidence interval of the mean expression level.


