
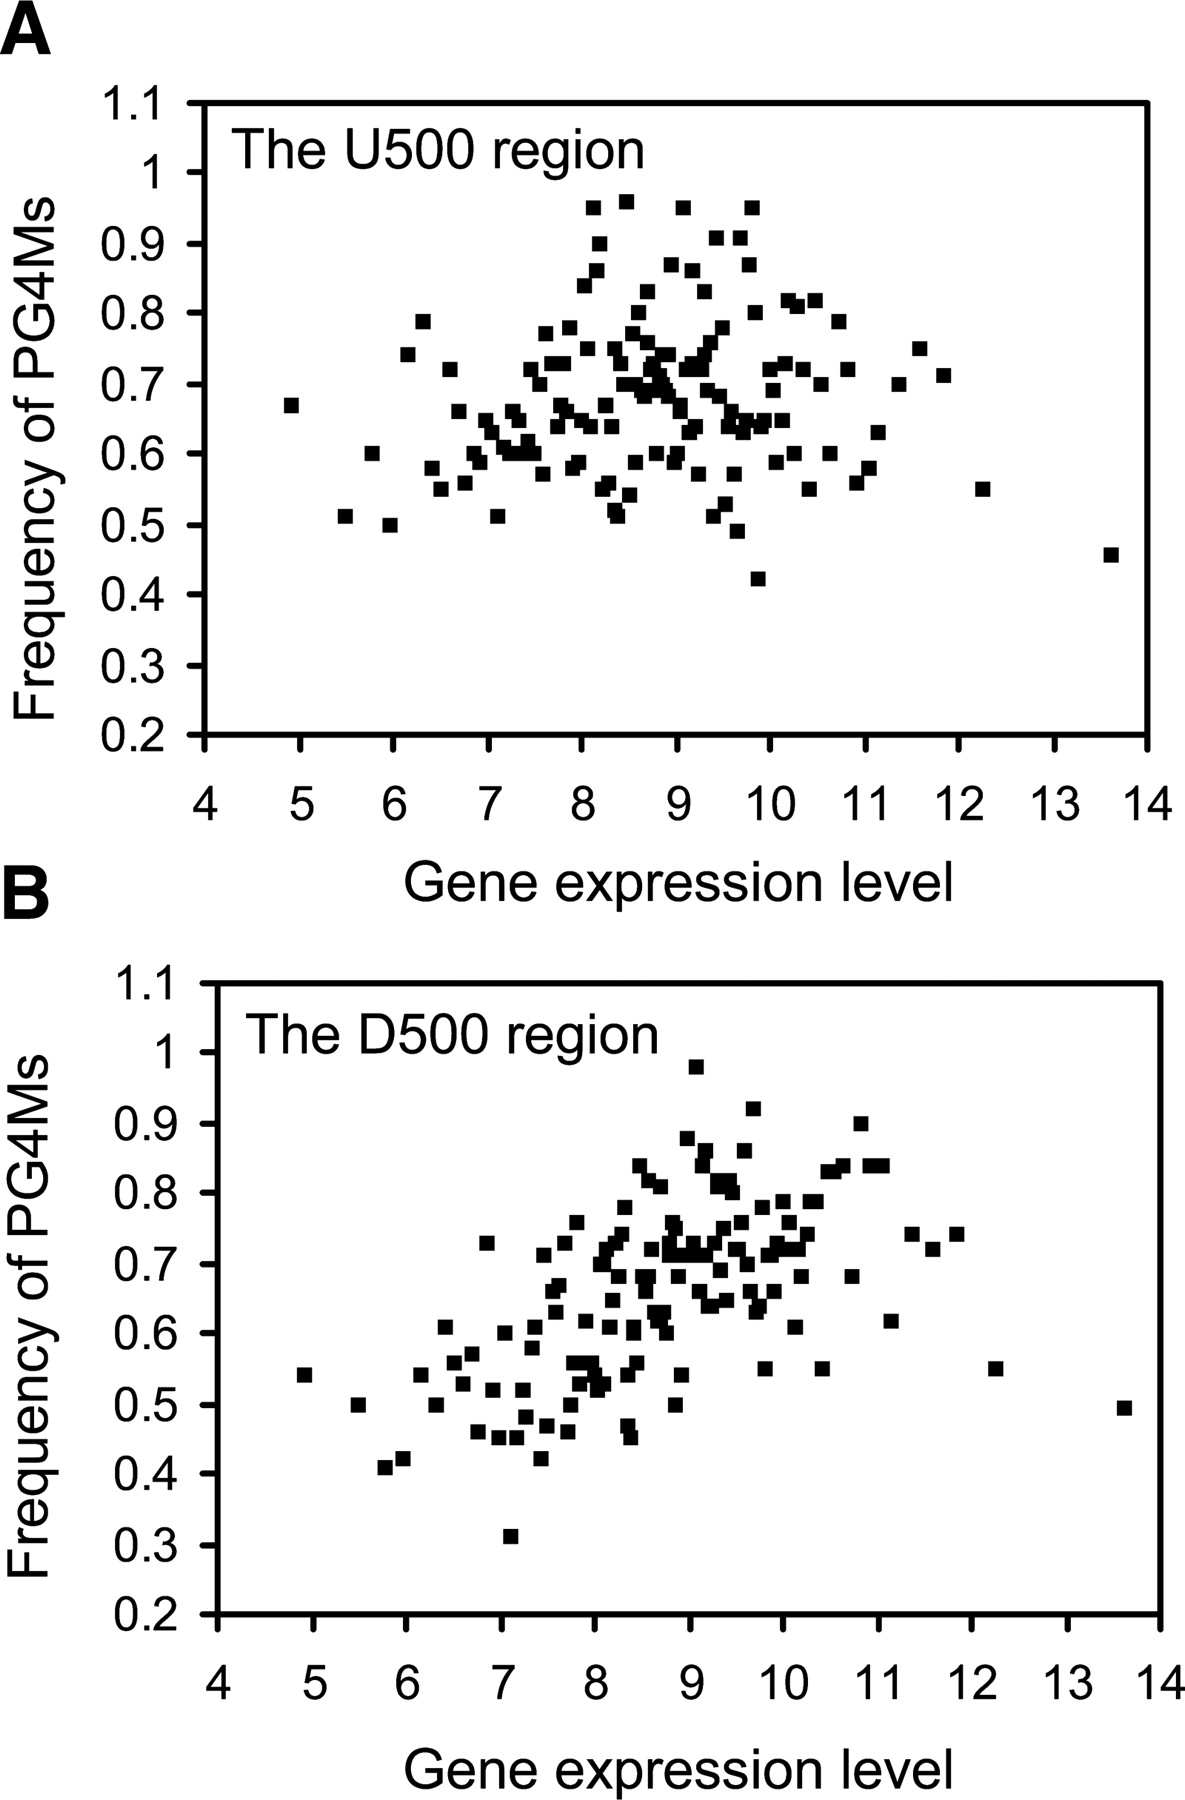
Figure 1.
Relationship between PG4Ms and gene expression level. Changes in the frequency of PG4MU500 (A) and PG4MD500 (B) with the increased gene expression level are plotted. Genes are ranked by expression level, with each point representing the mean expression level and the frequency of PG4Ms calculated for every 100 genes.


