
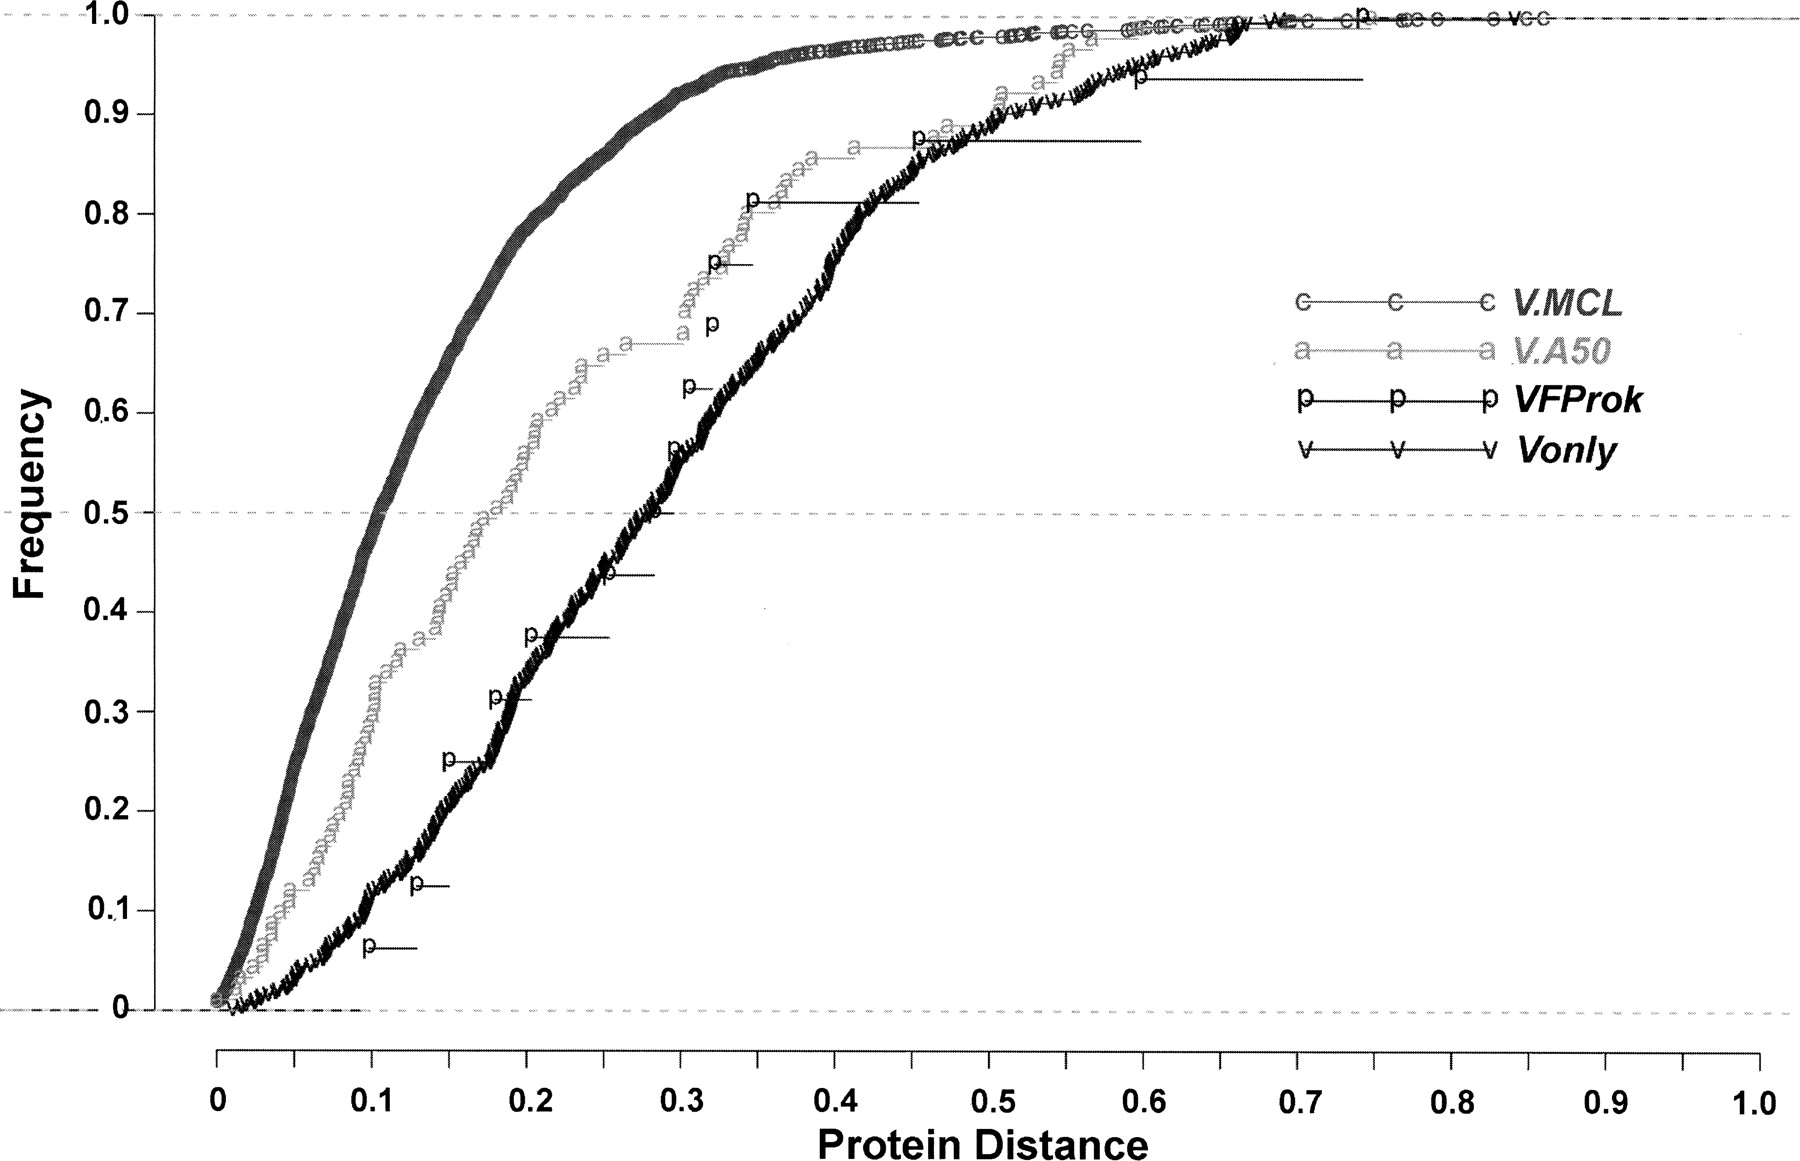
Figure 7.
The cumulative distributions of the uncorrected protein distances from the human–mouse ortholog pairs in the V.MCL, V.A50, VFProk, and Vonly gene groups.
(Downloading may take up to 30 seconds. If the slide opens in your browser, select File -> Save As to save it.)
Click on image to view larger version.
The cumulative distributions of the uncorrected protein distances from the human–mouse ortholog pairs in the V.MCL, V.A50, VFProk, and Vonly gene groups.
 CiteULike
 Delicious
 Digg
Digg Facebook
 Google+
 Reddit
 Twitter
