
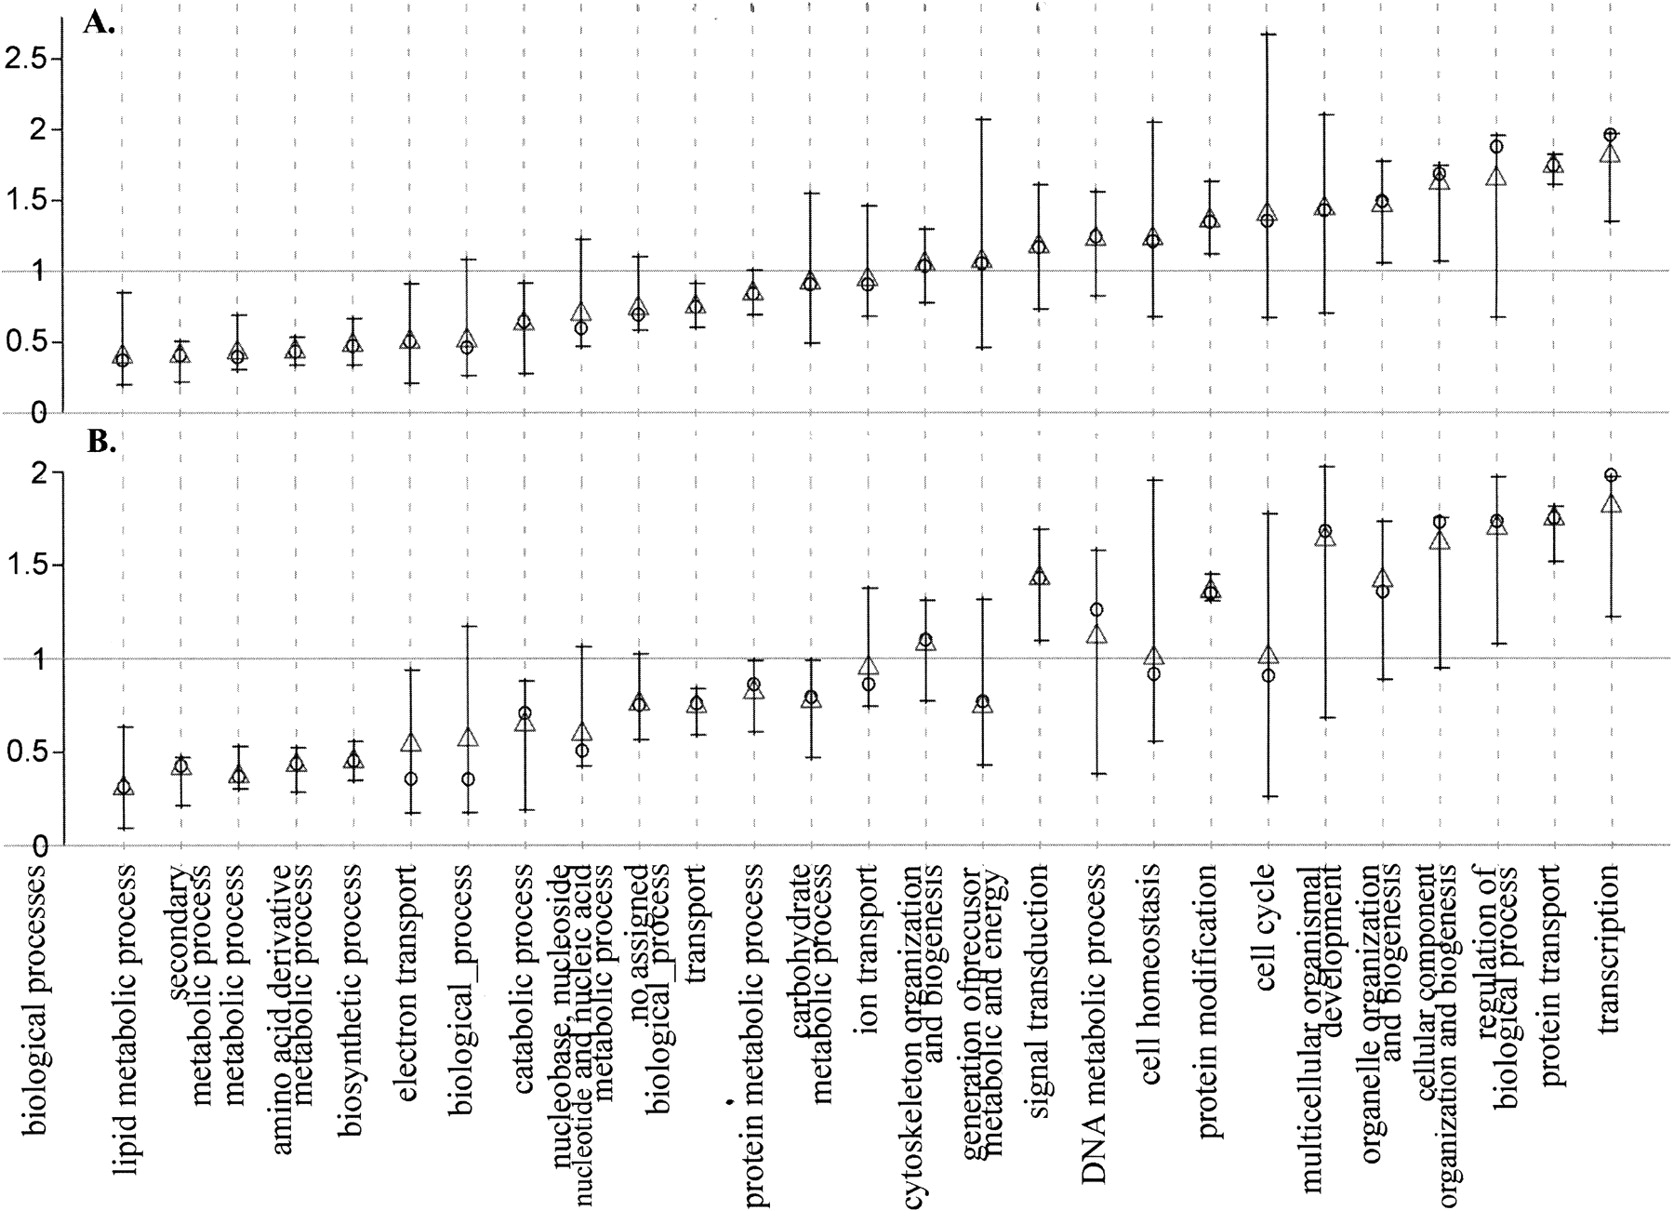
The slopes from a simple linear model (A) and a robust linear model (B) for the regression of the average vertebrate family size (nv) against the average invertebrate family size (ni) for each GOSlim biological process category in the V.MCL gene families. The error bar represents the 95% confidence interval of a slope from 1000 bootstrap replicates (see Methods). The slope from the original data and the mean of the bootstrapped slopes for each category are indicated by the circular and triangular points, respectively. The X-axis shows the biological process categories with the P-value < 0.01 for the null hypothesis of the estimated slope = 0 in either the simple linear model or the robust linear model, indicating a significant correlation between nv and ni. These categories are ordered by the mean of their bootstrapped slopes in A. Most of the proteins with GOSlim in the “biological_process” category are those involved in cell adhesion, response to stimulus, sensory perception of smell, immune response, homophilic cell adhesion, and defense response. Furthermore, most of these gene families are also assigned to other GOSlim categories (mainly to signal transduction, regulation of biological process, response to stress, or multicellular organismal development).


