
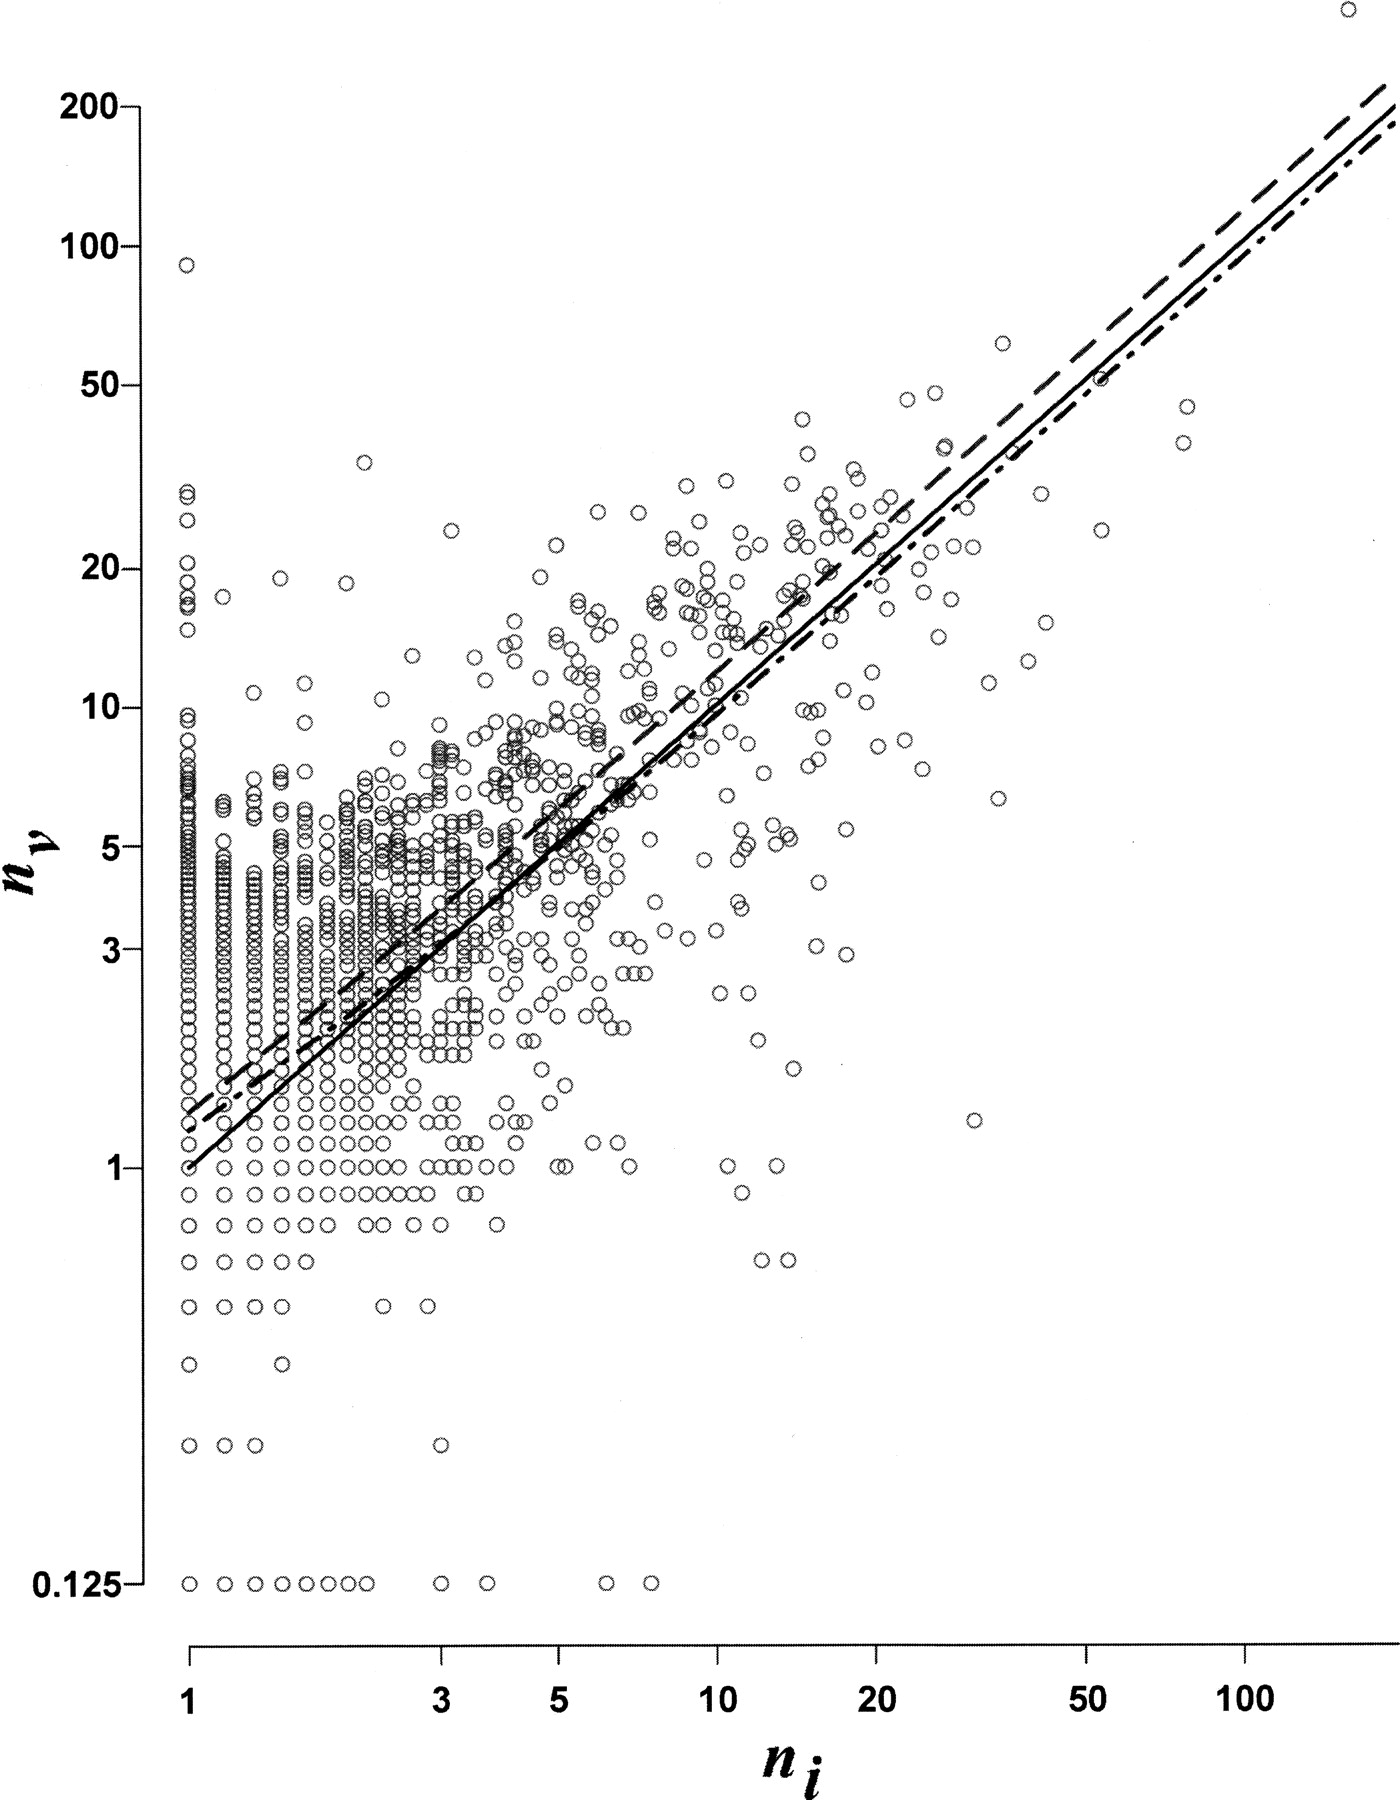
The family-size correlation between the vertebrate and invertebrate genomes. Scatter plots, on the log-scale axes, show the average vertebrate family size (nv) against the average invertebrate family size (ni) for each V.MCL gene family. The black solid line represents nv = ni, while the one-dashed and two-dashed lines represent the fitted lines from the simple linear regression model and the robust linear regression model, respectively (nv = β0 + β1 ni). The slopes (i.e., β1 estimates) for the one-dashed and two-dashed fitted lines are 1.15 (R2 = 0.63) and 0.92, with the bootstrapped 95% confidence intervals of β1 estimates being (0.72, 1.54) and (0.78, 1.09), respectively. The bootstrapped P-values are 0.73 and 0.21 for the null hypothesis of β1 = 1 from the simple regression model and the robust linear regression model, respectively, so that the slopes are not significantly different from 1.


