
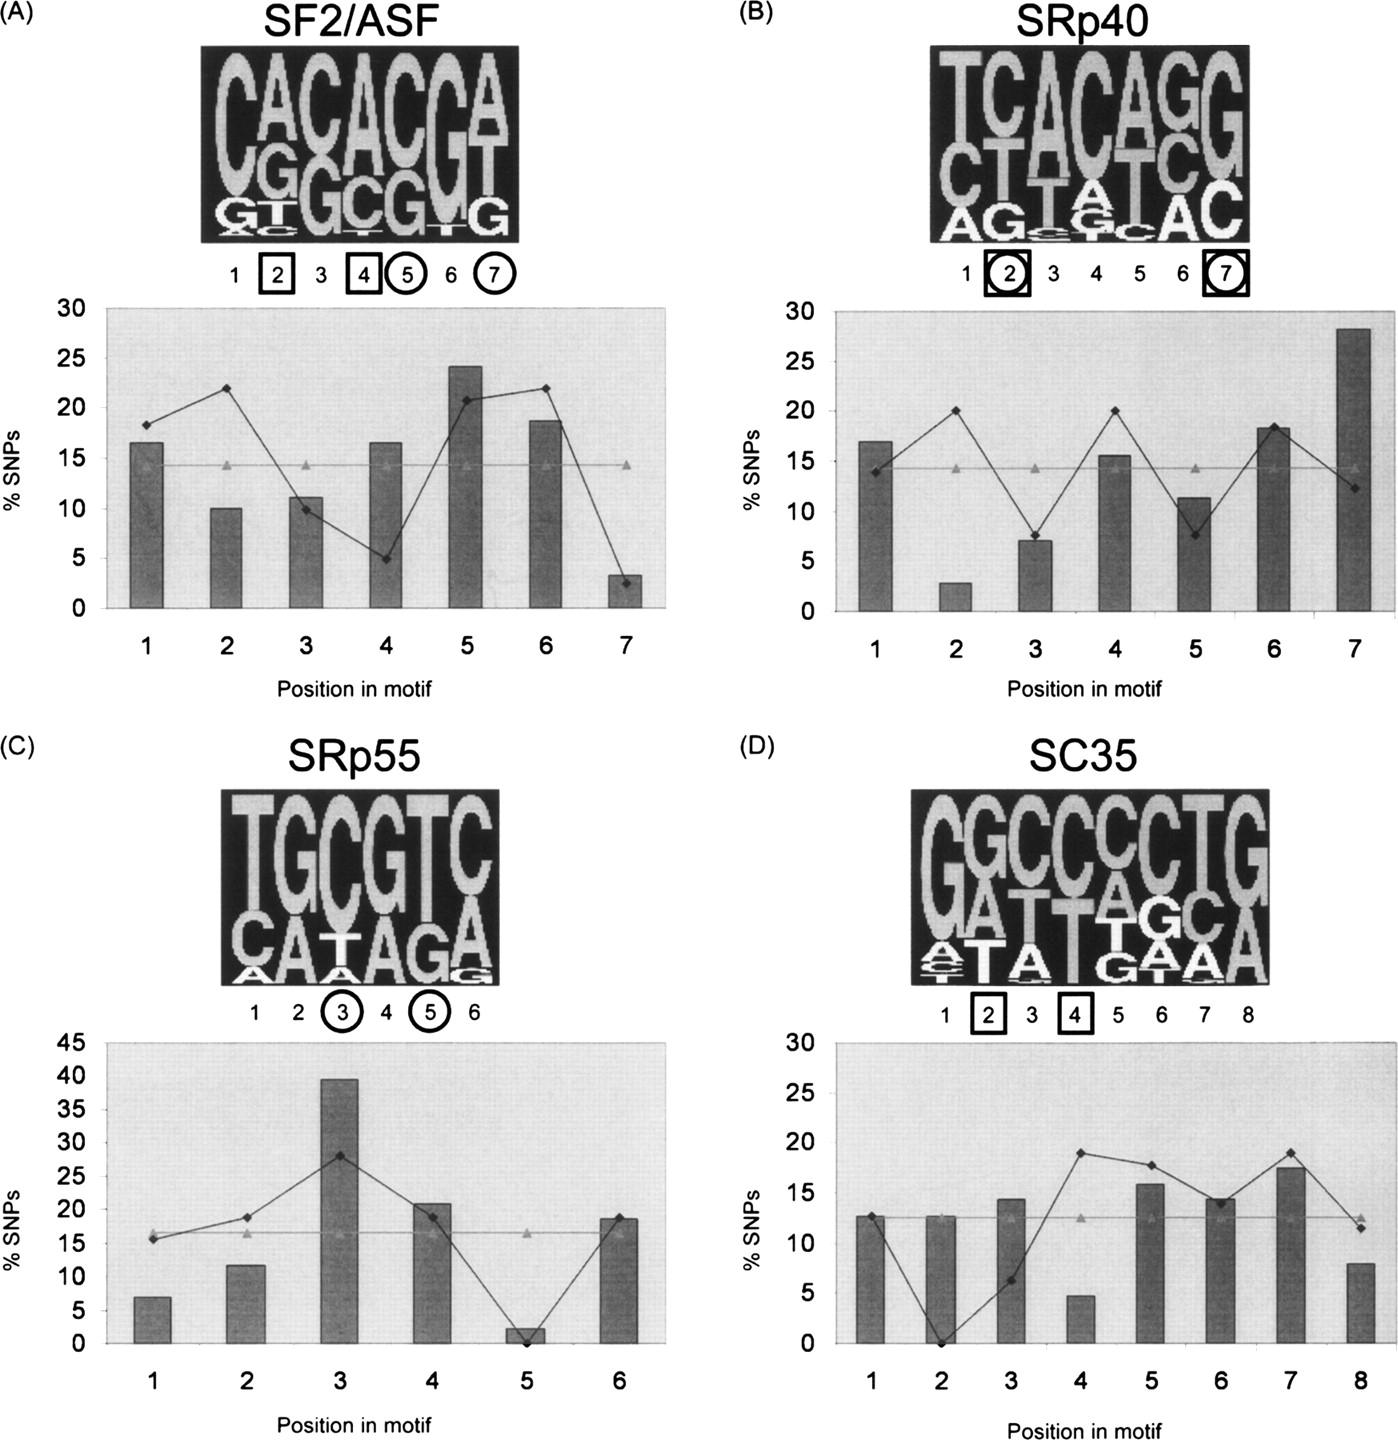
Extreme BMI synonymous SNPs are located in specific positions within ESEfinder motifs. The distribution of the synonymous extreme BMI SNPs within motifs of (A) SFRS1, (B) SFRS5, (C) SFRS6, and (D) SFRS2 is plotted. For each panel, the percentage of SNPs (Y-axis) in each position (X-axis) is indicated. For comparison, the light gray and black lines indicate the expected percentages for random data and the percentages of the rare UCSC SNPs, respectively. The pictogram was adopted from Cartegni et al. (2003) and reflects the consensus motif sequence. Positions with a significant percentage of SNPs, compared with the random data or with the rare UCSC SNPs, are marked in circles or squares, respectively.


