
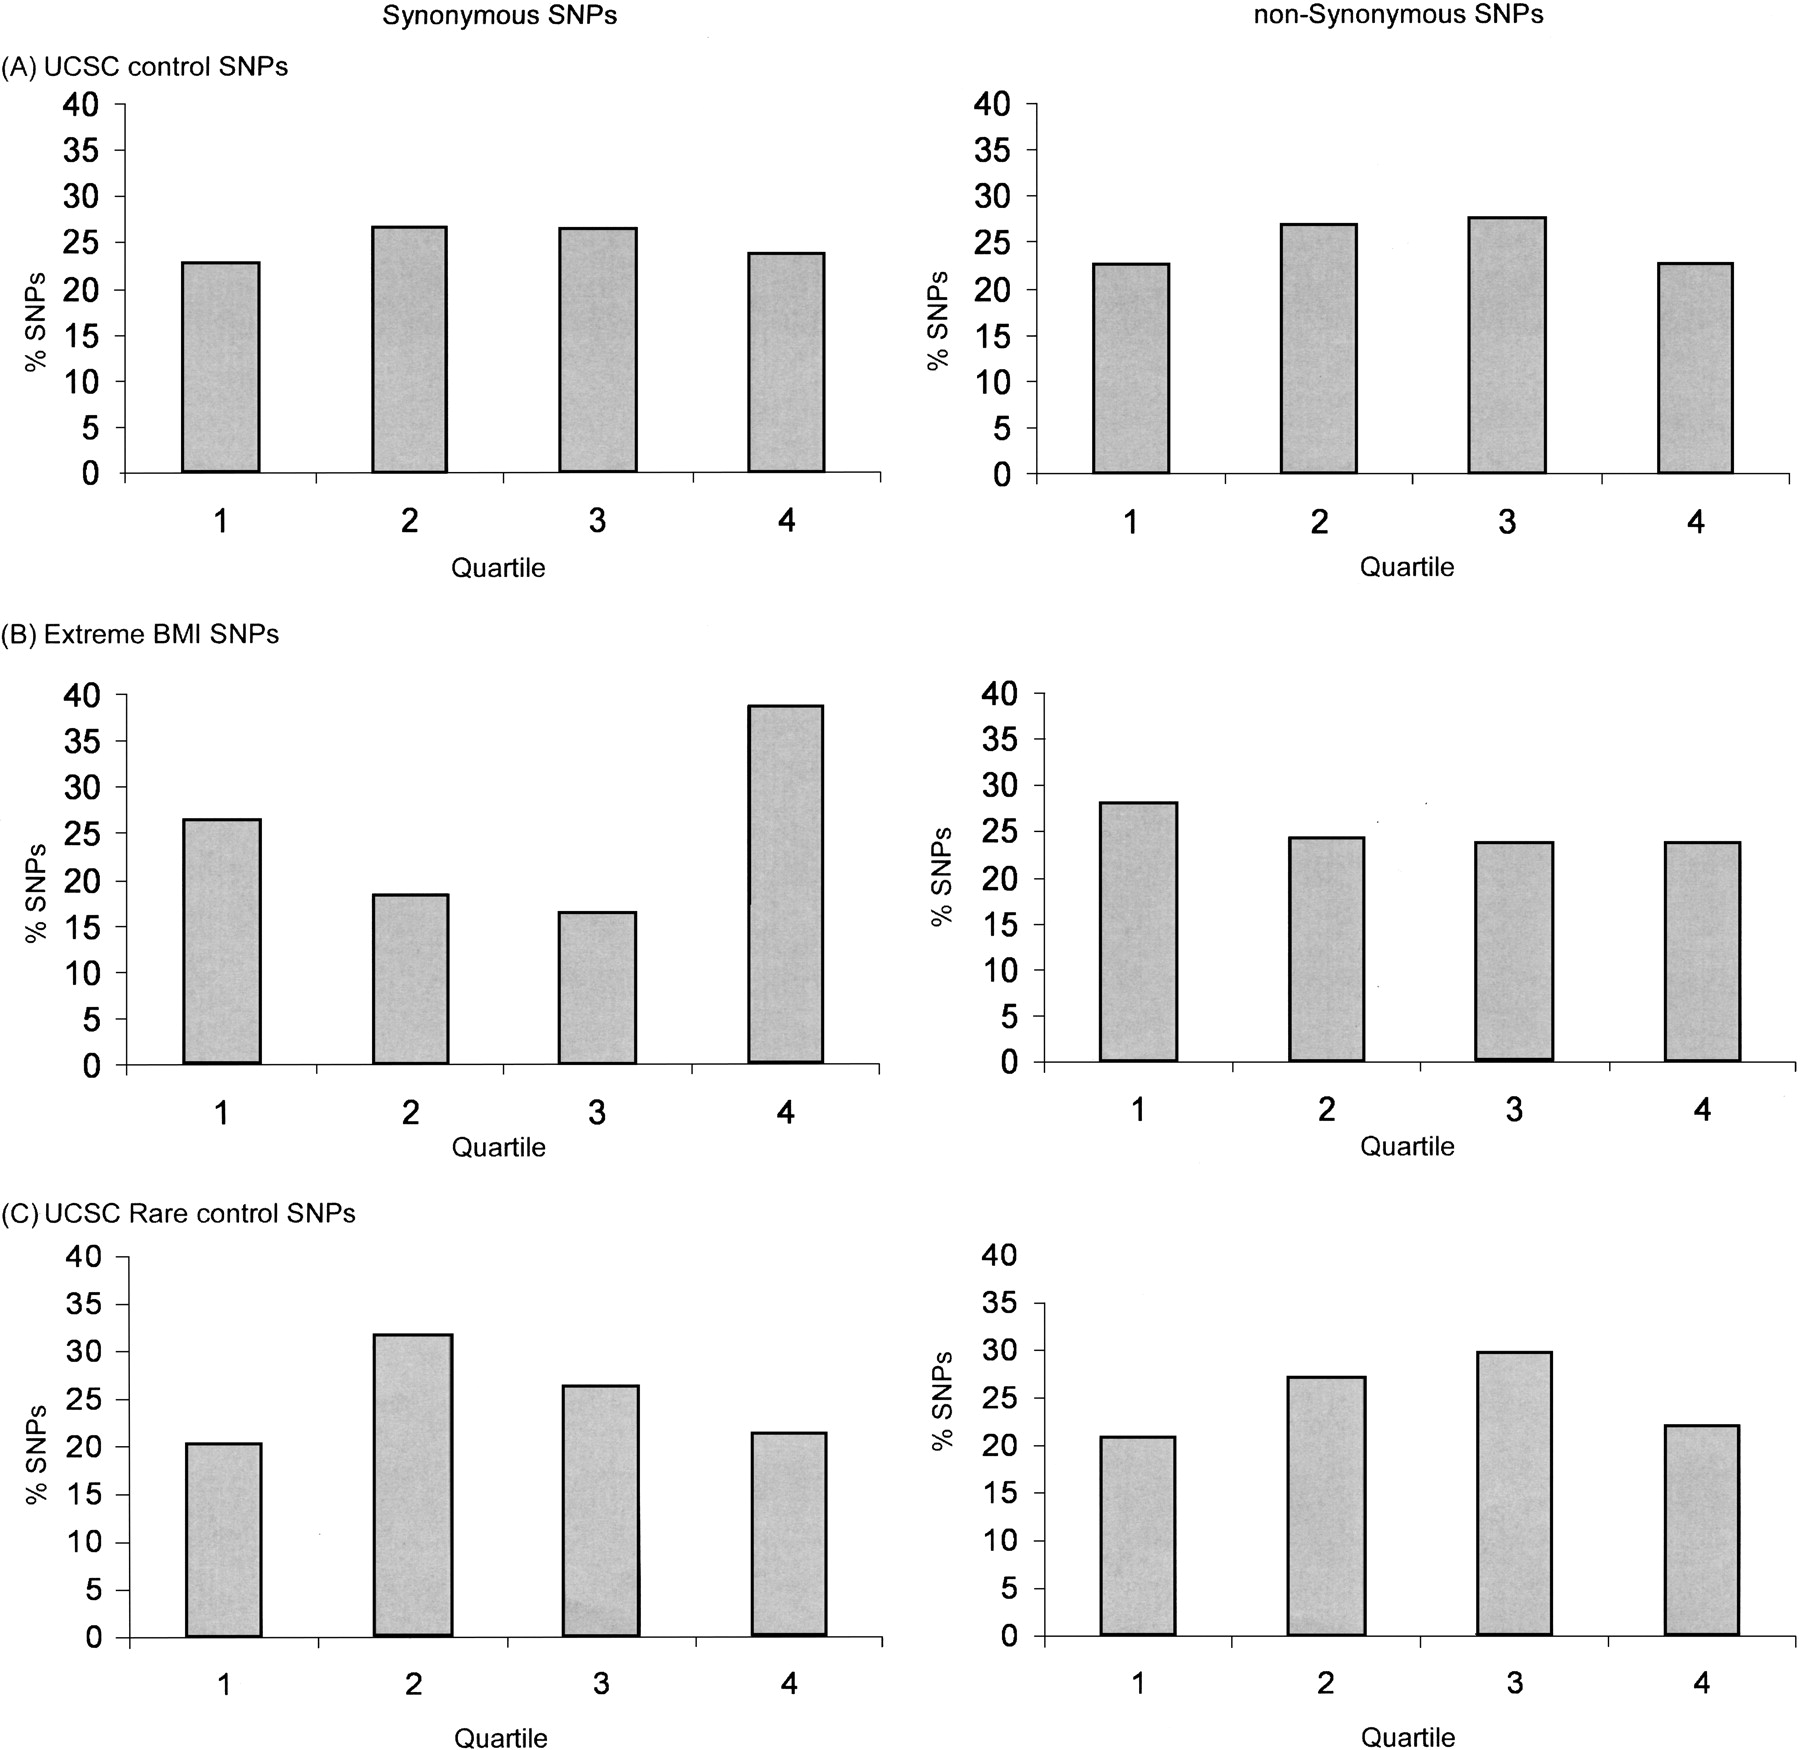
Figure 1.
Distribution of extreme BMI SNPs and UCSC SNPs along exons. The distribution of SNPs was calculated for (A) UCSC SNP containing exons; for (B) extreme BMI SNP containing exons; and for (C) UCSC rare SNP containing exons. These calculations were performed for both synonymous (left panels) and nonsynonymous (right panels) SNPs. Each exon was divided into four quartiles (X-axis). The percentage of SNPs in each of the four quartiles is indicated (Y-axis).


