
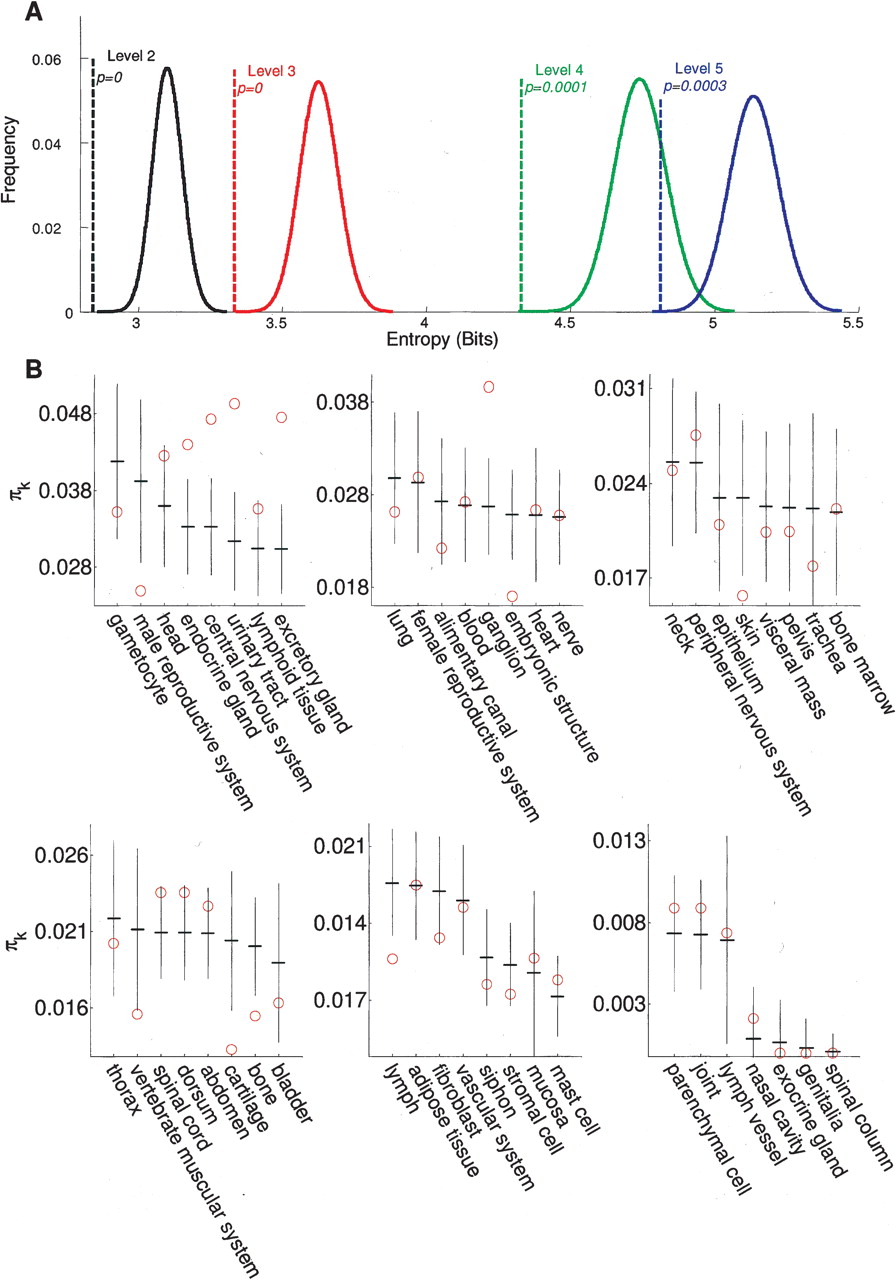
Expression patterns of genes targeted by successful drugs. (A) Distribution of Shannon entropy of gene expression for randomly sampled genes and for drug targets; the successful drug targets have significantly lower entropies of expression (higher tissue-specificity) at all four levels. See Methods for details on the tissue ontology levels. (B) Comparison of the expected proportion of drug targets per tissue under unbiased target selection conditions—(vertical solid lines) 95% confidence intervals; (dashes on the vertical lines) means—with (open circles) the actual proportion of successful drug targets per tissue. The plot indicates that there are tissues that are significantly over- and undertargeted.


