
Figure 1.
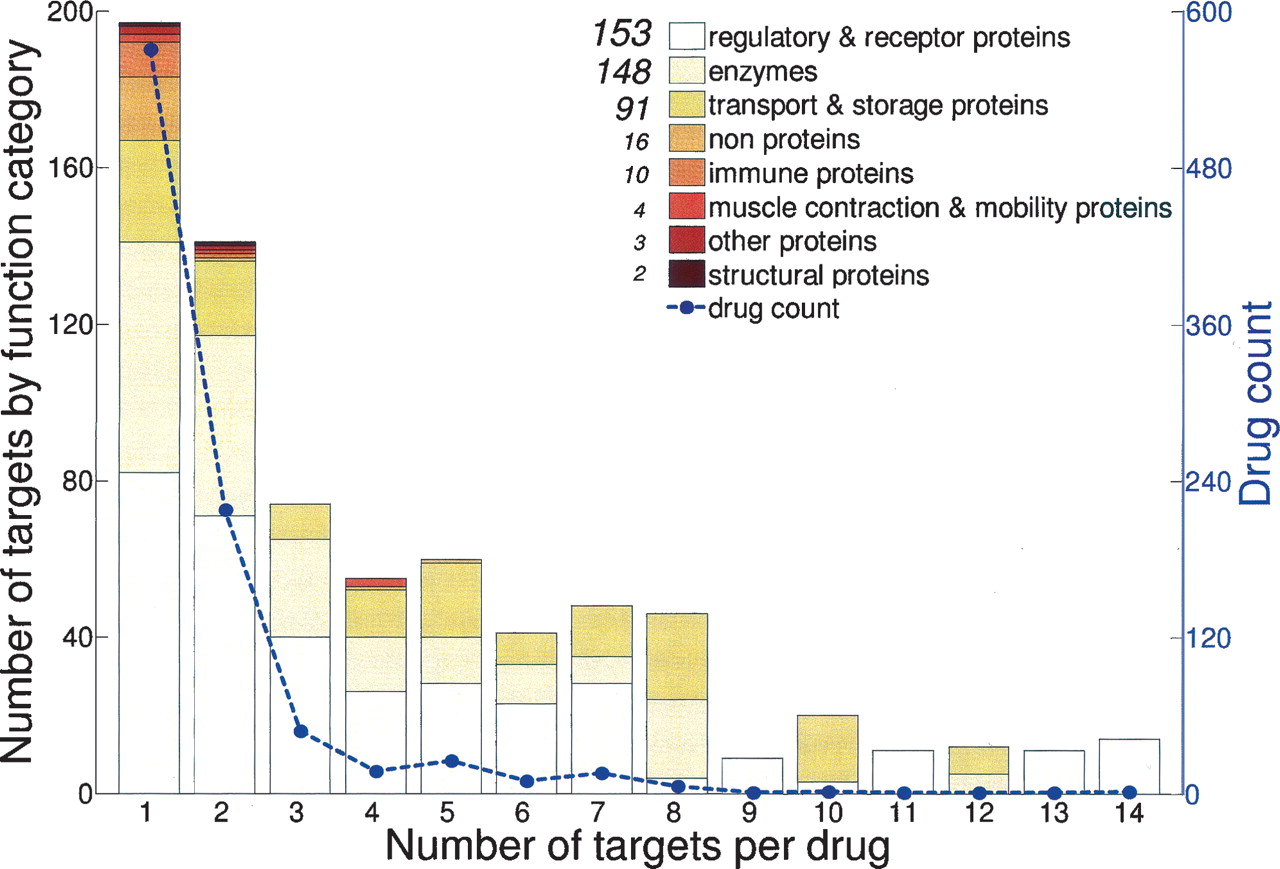
Distribution of the number of human gene targets per successful drug. The plot is superimposed on a family classification of drug targets.
(Downloading may take up to 30 seconds. If the slide opens in your browser, select File -> Save As to save it.)
Click on image to view larger version.
Distribution of the number of human gene targets per successful drug. The plot is superimposed on a family classification of drug targets.
 CiteULike
 Delicious
 Digg
Digg Facebook
 Google+
 Reddit
 Twitter
