
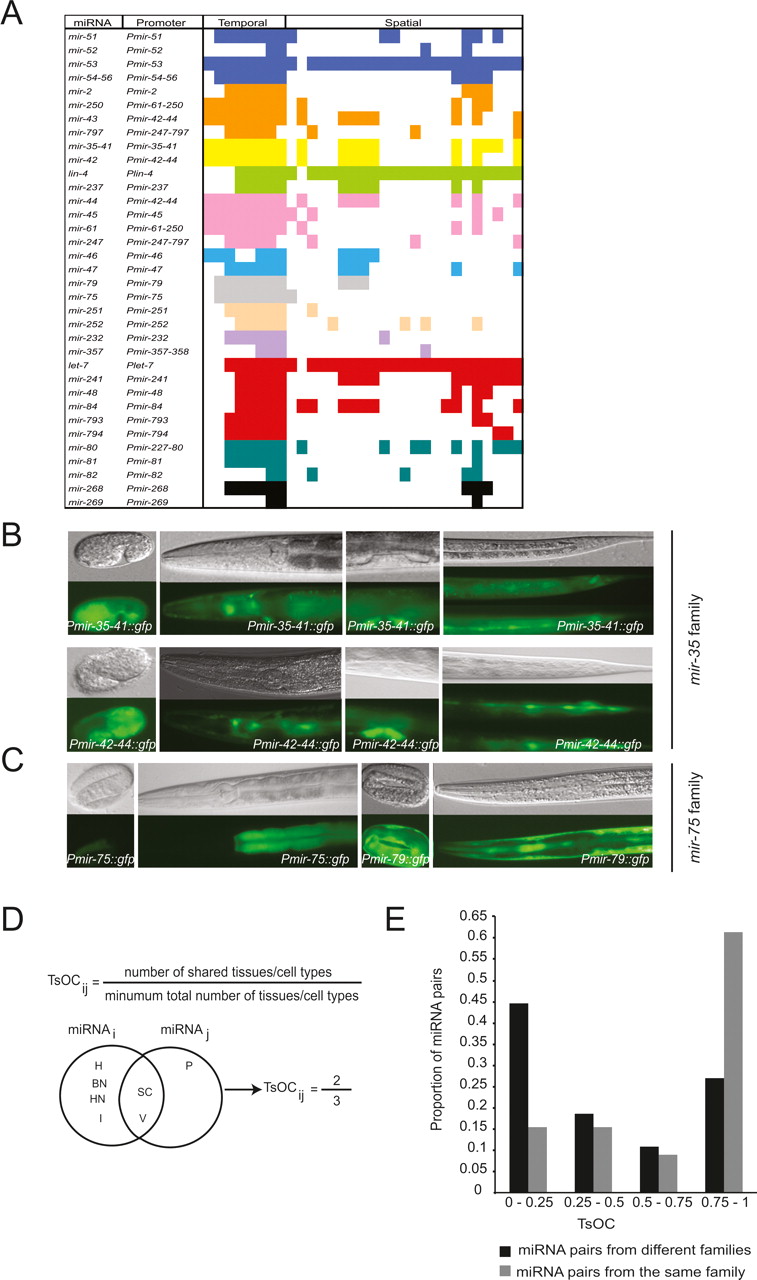
Figure 5.
miRNAs from a given family can have overlapping as well as different spatiotemporal expression patterns. (A) Cartoon depicting expression patterns of 10 complete and two incomplete (let-7 and mir-80 families shown at the bottom) miRNA families. Each color represents a family. Spatiotemporal expression is as in Supplemental Table S3. (B) miRNAs from the mir-35 family are expressed in overlapping tissues/cell types. Pmir35-41∷gfp and Pmir-42-44∷gfp are shown. (C) miRNAs from the mir-75 family are expressed in different tissues/cell types. (Top) DIC images; (bottom) GFP fluorescence. (D) Definition and example of TsOC between any two miRNAs. (E) Distribution of TsOC among miRNA pairs from the same or different family.


