
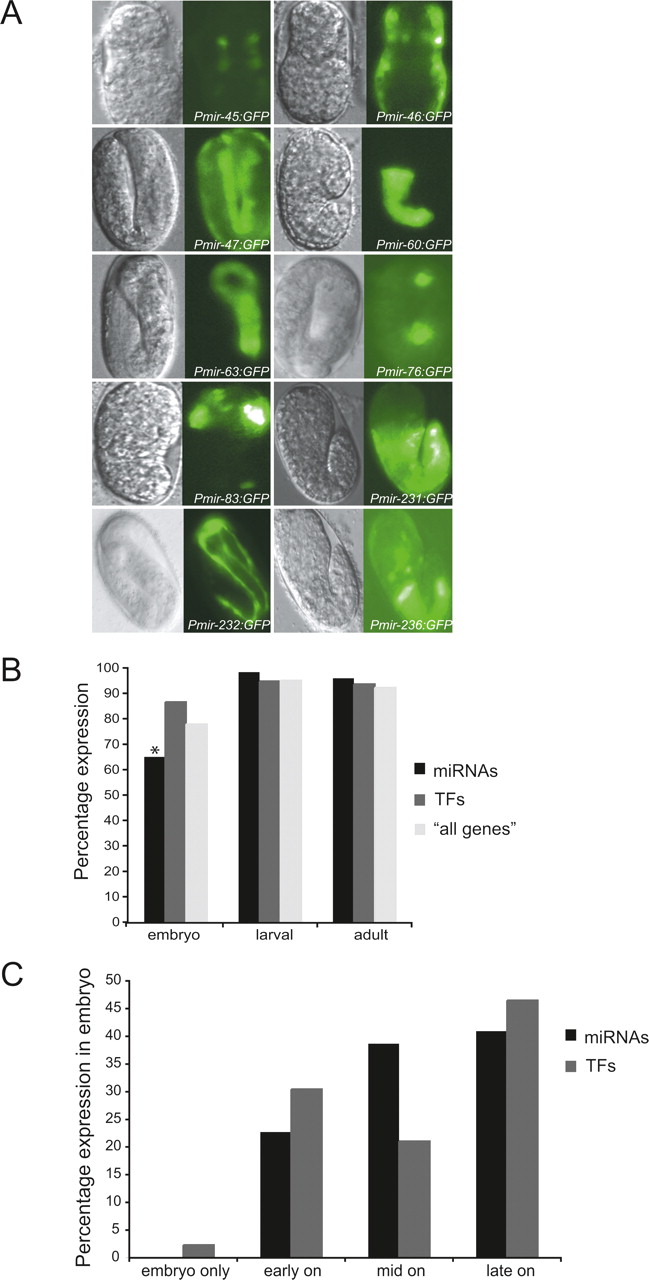
Figure 3.
Temporal miRNA promoter activity. (A) Representative images of miRNA promoters that drive GFP expression in the embryo. (Left) DIC images; (right) GFP fluorescence. Additional images can be found in the EDGEdb database (Barrasa et al. 2007). (B) miRNAs tend to be expressed later in development compared to TFs and “all genes.” The asterisk indicates a significant difference (P < 0.05). (C) Percentage of miRNA and TF promoters that drive expression in the embryonic stage: embryo only, early, mid, and late embryonic stages.


