
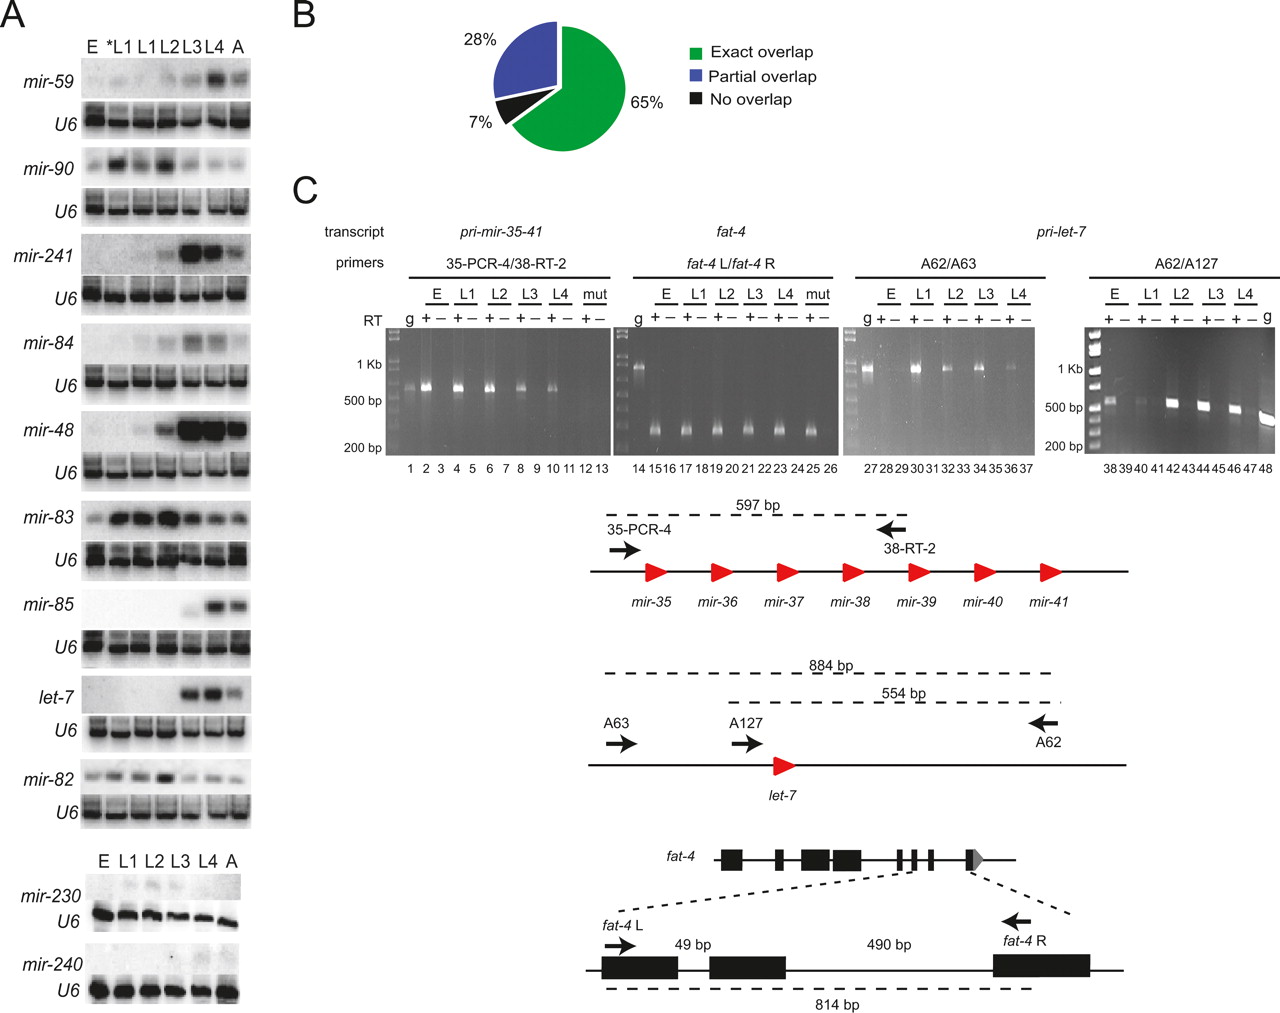
Temporal PmiRNA∷gfp activity correlates with Northern blot analysis and uncovers possible post-transcriptional mechanisms that control miRNA expression. (A) Northern blot analyses using StarFire probes detect temporal expression of mature miRNAs. E indicates embryo; L, larvae; *L1, starved L1; A, adult. Probe against the U6 snRNA was used as control. (B) Comparison between miRNA expression determined by Northern blotting and promoter∷gfp reporters. (C) Detection of mir-35-41 and let-7 primary transcripts by RT-PCR. As control, we used primers to amplify a protein-coding mRNA (fat-4). Total RNA from N2 embryos, L1, L2, L3, and L4 stages and total RNA from VC514 mir-35-41 mutant embryos (mut) were subjected to reverse transcription (+RT, lanes 2,4,6,8,10,12,15,17,19,21,23,25,28,30,32,34,36,38,40,42,44,46) or mock reactions (−RT, lanes 3,5,7,9,11,13,16,18,20,22,24,26,29,31,33,35,37,39,41,43,45,47). Genomic DNA was used as size marker (g, lanes 1,14,27,48). Cartoons indicate the predicted size of PCR amplicons from mir-35-41 primary transcript, let-7 primary transcript, and fat-4 mRNA and indicate the primers that were used. Note that fat-4 L and R primers amplify a product of different size when genomic DNA (lane 14) or cDNA (lanes 15–26) was used as template.


