
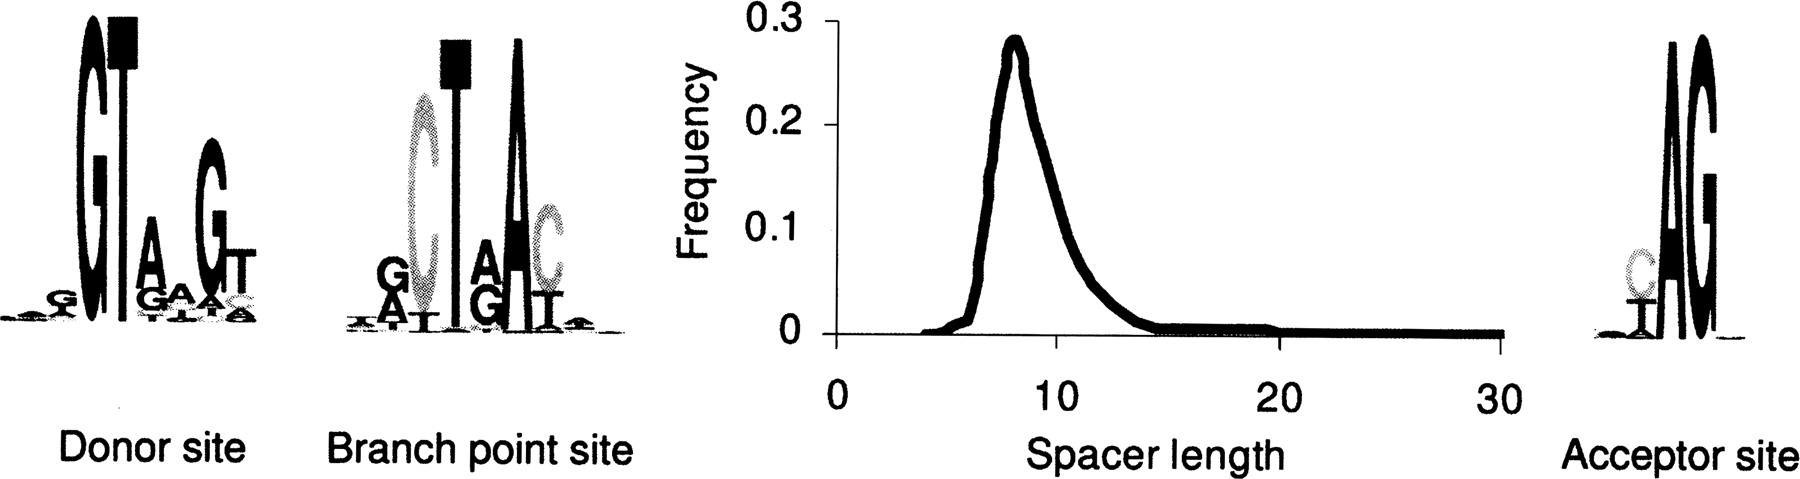
Figure 3.
The logos of splice sites and branch point models as well as the graph of the length distribution of the spacer between branch point and acceptor site (as determined for the S. nodorum genome).


