
Annotation analysis of genes with liver T-DMRtags
Click on table to view larger version.
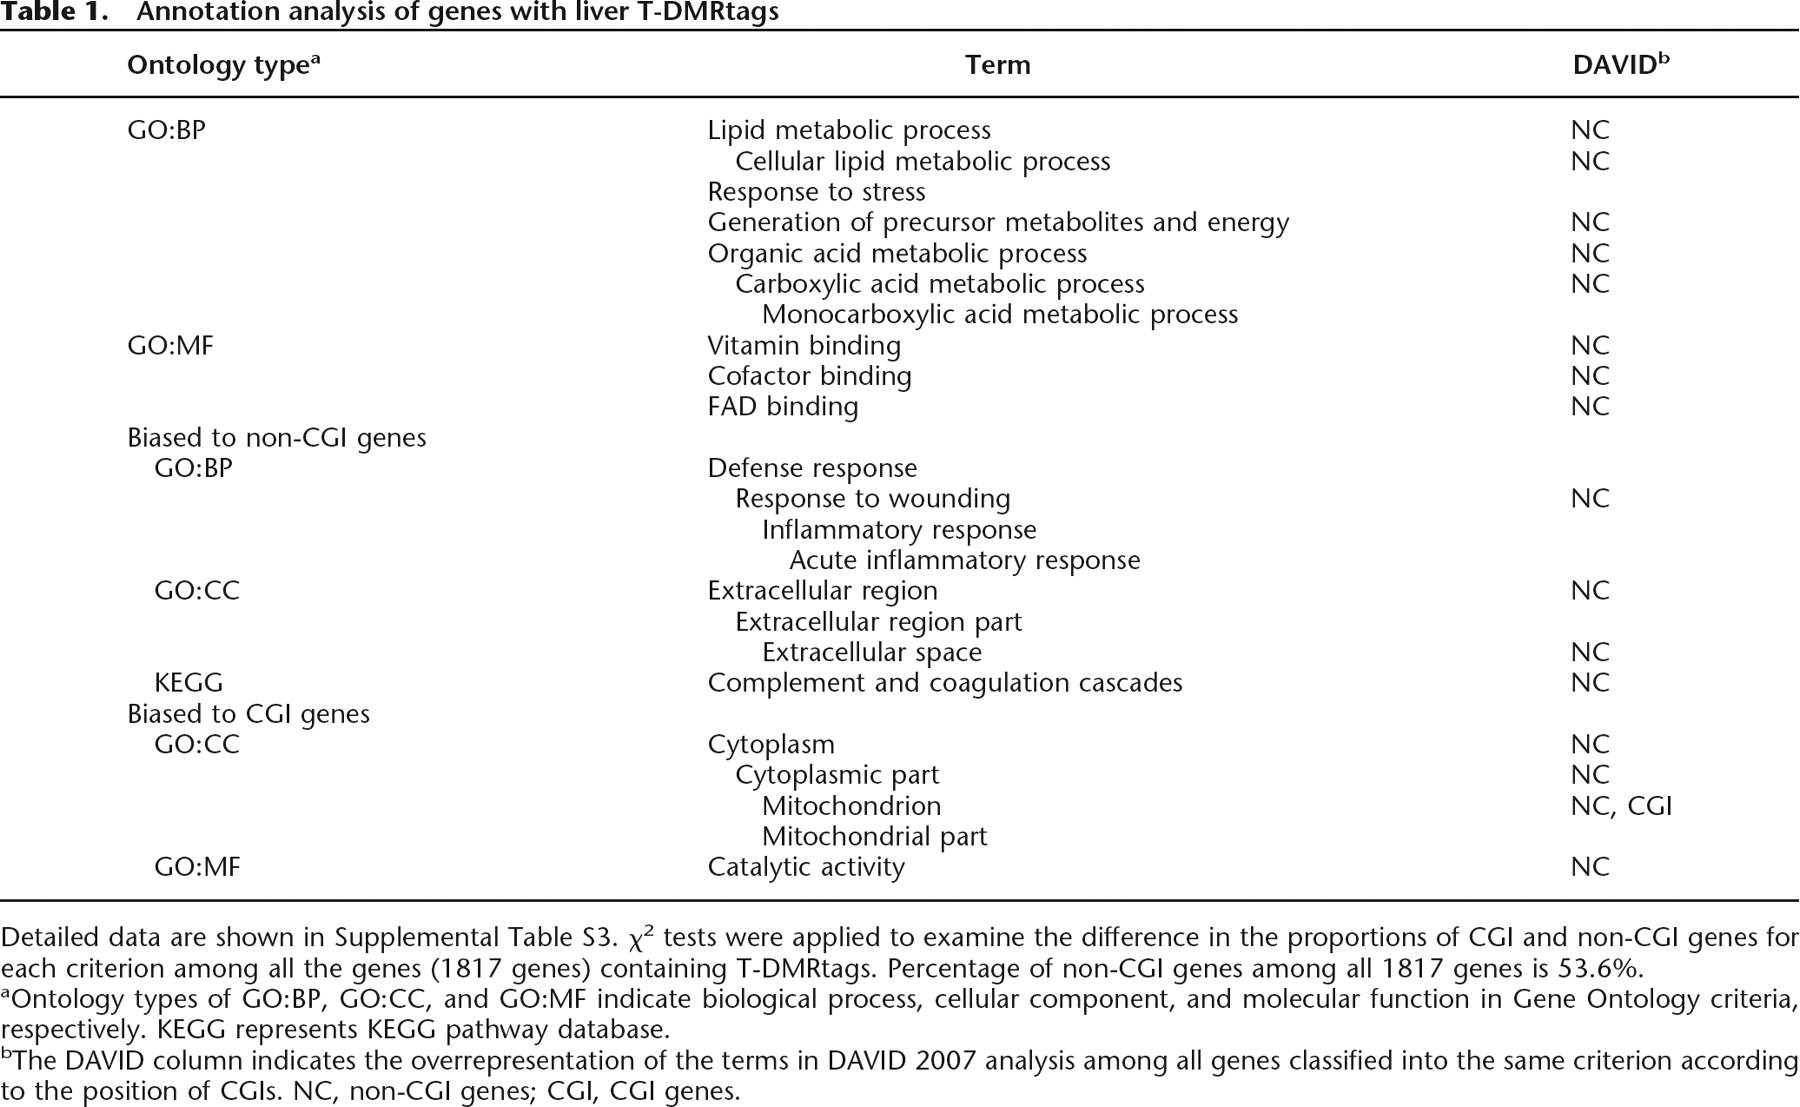
Detailed data are shown in Supplemental Table S3. χ2 tests were applied to examine the difference in the proportions of CGI and non-CGI genes for each criterion among all the genes (1817 genes) containing T-DMRtags. Percentage of non-CGI genes among all 1817 genes is 53.6%.
aOntology types of GO:BP, GO:CC, and GO:MF indicate biological process, cellular component, and molecular function in Gene Ontology criteria, respectively. KEGG represents KEGG pathway database.
bThe DAVID column indicates the overrepresentation of the terms in DAVID 2007 analysis among all genes classified into the same criterion according to the position of CGIs. NC, non-CGI genes; CGI, CGI genes.


