
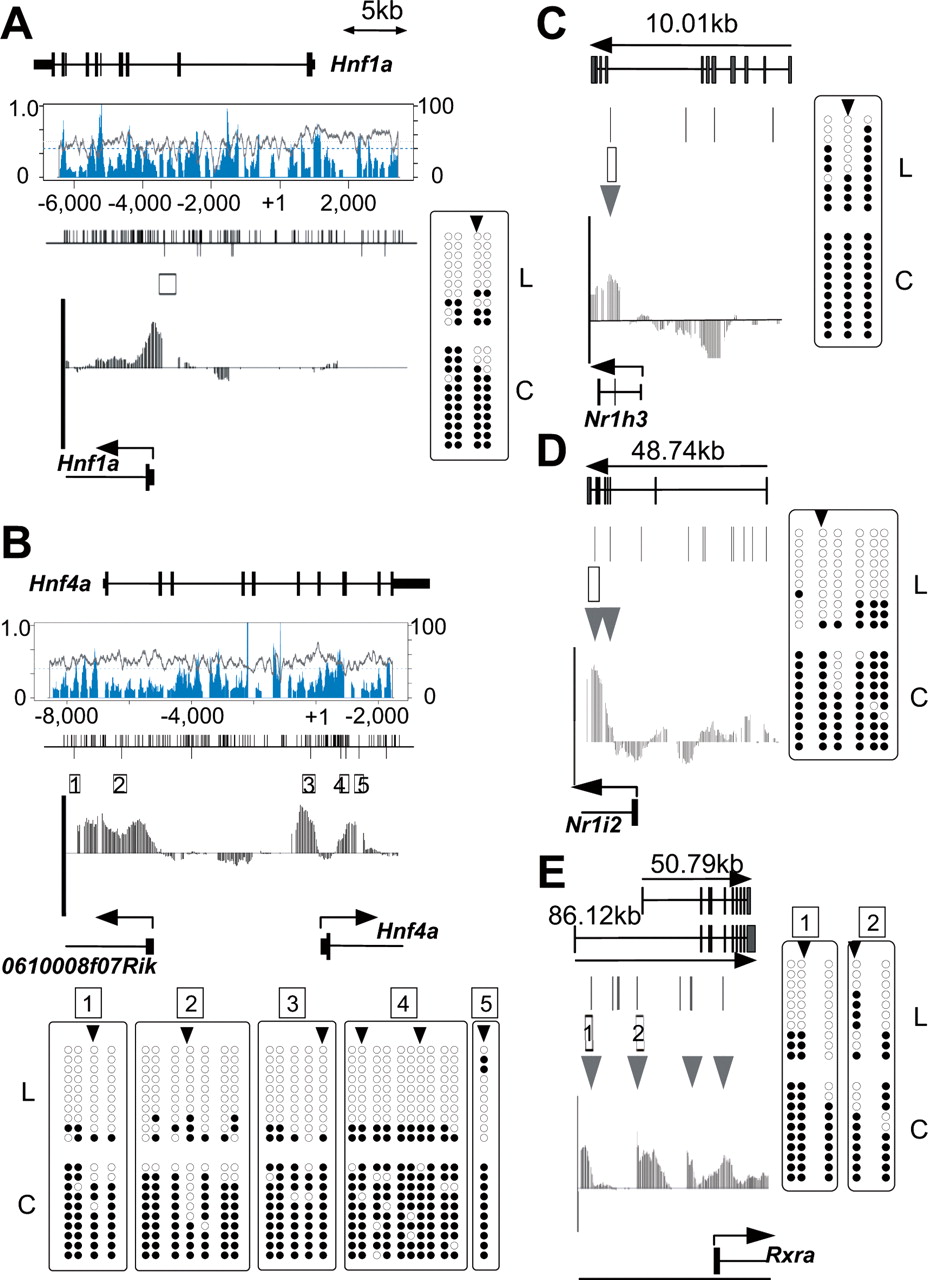
Bisulfite sequencing of T-DMRs of liver-specific transcription factors, as Hnf1a (A), Hnf4a (B), Nr1h3 (C), Nr1i2 (D), and Rxra (E). Genomic structures are presented at the top of each figure section. The graphs in boxes toward the center in A and B represent CpG density (blue) and GC percentages (gray). The bars visible along the top of the center lines in A and B represent CpG dinucleotide positions; bars below represent HpyCH4IV sites. Boxes and arrowheads represent T-DMRs and T-DMRtags, respectively. IGB plots of comparative microarray signals corresponding to the regions in the abovementioned figures are displayed toward the bottom of the middle sections. Bisulfite sequencing data obtained for 10 isolates from liver (L) and cerebrum (C) are summarized at the bottom or side of the figure section. Open and closed circles represent unmethylated and methylated CpG, respectively.


