
Over-representation of gray and rapidly diverged gene families in Graveyard (G) and Interrupter (I) chromosomal positions, and how the average gene is positioned more like a gray gene than a control transcription factor gene (TF)
Click on table to view larger version.
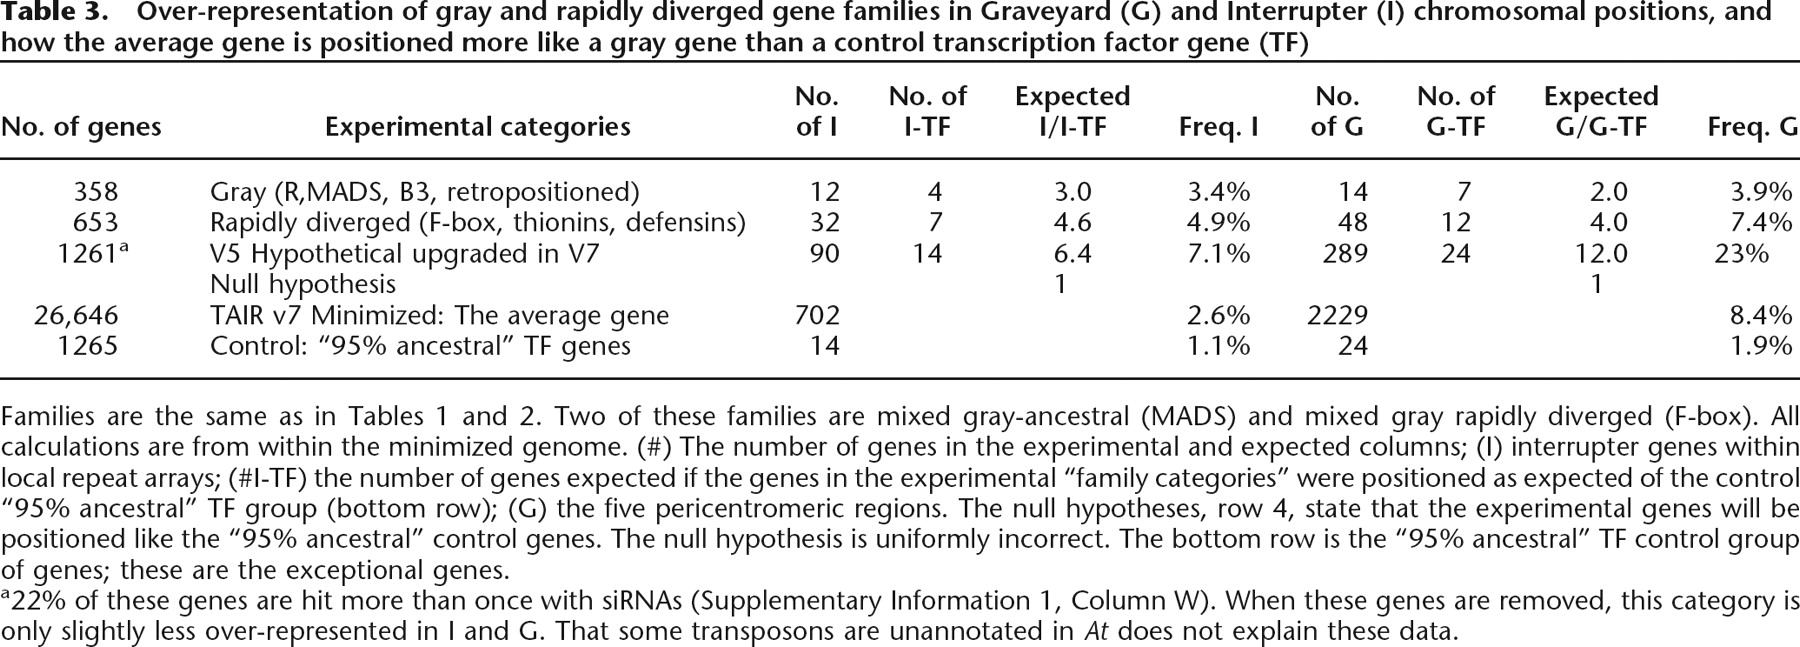
Families are the same as in Tables 1 and 2. Two of these families are mixed gray-ancestral (MADS) and mixed gray rapidly diverged (F-box). All calculations are from within the minimized genome. (#) The number of genes in the experimental and expected columns; (I) interrupter genes within local repeat arrays; (#I-TF) the number of genes expected if the genes in the experimental “family categories” were positioned as expected of the control “95% ancestral” TF group (bottom row); (G) the five pericentromeric regions. The null hypotheses, row 4, state that the experimental genes will be positioned like the “95% ancestral” control genes. The null hypothesis is uniformly incorrect. The bottom row is the “95% ancestral” TF control group of genes; these are the exceptional genes.
a22% of these genes are hit more than once with siRNAs (Supplementary Information 1, Column W). When these genes are removed, this category is only slightly less over-represented in I and G. That some transposons are unannotated in At does not explain these data.


