
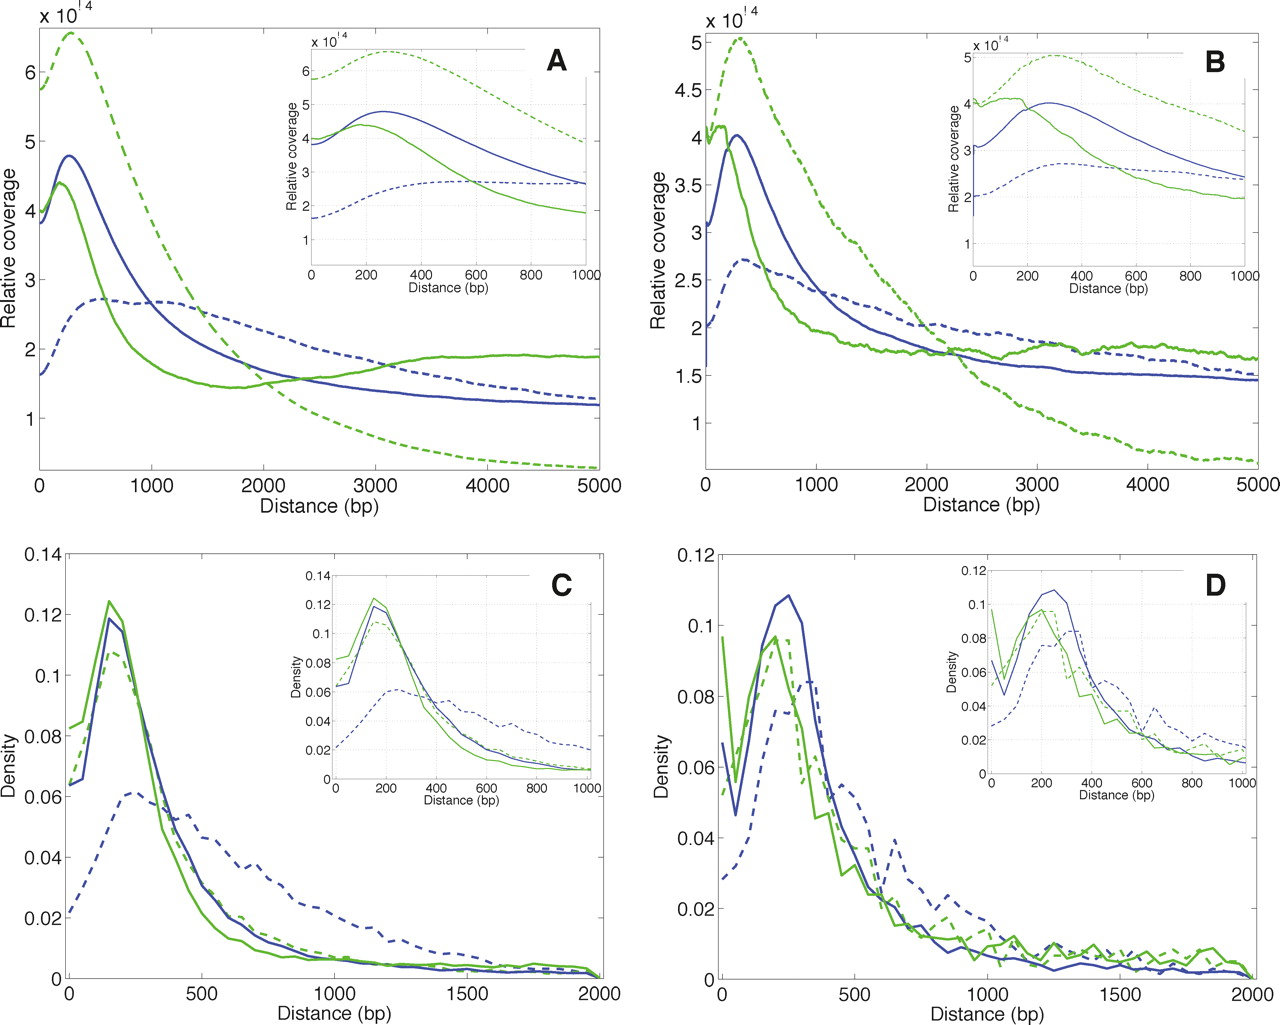
Figure 3.
Spatial relationships for TF-associated H3K4me1 and H3Kme3. Coverage profiles associated with STAT1 in IFNG-stimulated HeLa cells (A) and FOXA2 in mouse adult liver (B). Density distributions for distances between the location of maximal coverage for a region enriched in STAT1 (C) or FOXA2 (D) and the closest H3K4me1- or H3K4me3-enriched region. (Blue lines) H3K4me1; (green lines) H3K4me3; (solid lines) profiles for distal TF regions; (dashed lines) profiles for proximal TF regions. We distinguished these groups using a ±2.5-kb threshold distance from UCSC hg18 or mm8 known gene TSS. The area under each curve was normalized to 1.0.


