
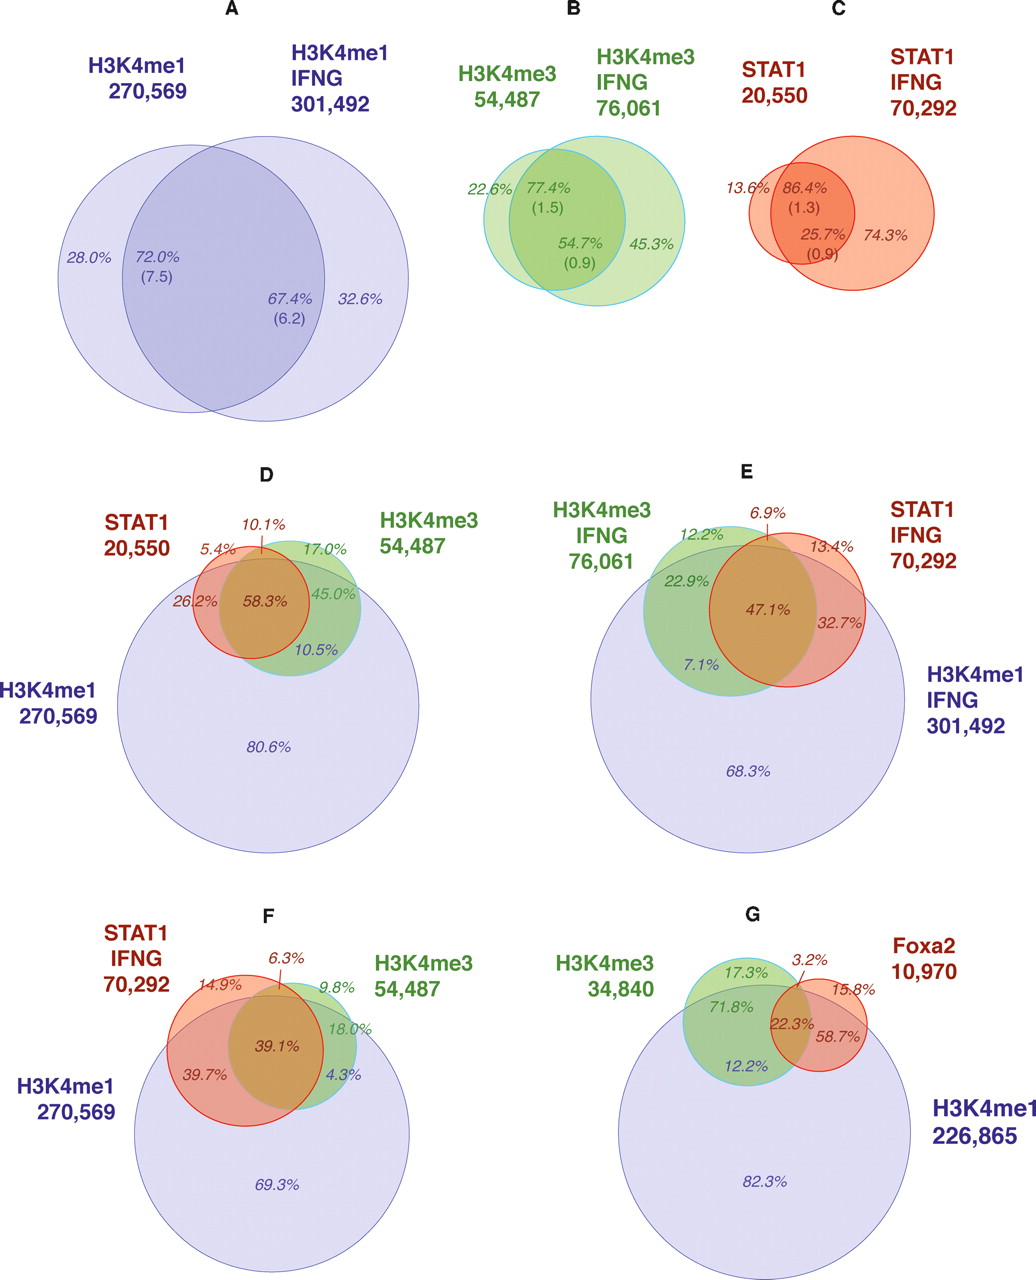
Association and concordance rates. Concordance rates between unstimulated and IFNG-stimulated HeLa cells for H3K4me1 (A), H3K4me3 (B), and STAT1 (C), using FDR ∼0.01 profiles, with random expectations in parentheses. Association rates between STAT1 and H3K4me1/me3 in unstimulated (D) and stimulated (E) HeLa cells. (F) Association rates between STAT1 in IFNG-stimulated cells and H3K4me1/H3K4me3 in unstimulated cells. (G) Association rates between FOXA2, H3K4me1, and H3K4me3 in adult mouse liver. (A–C) Concordance rates relative to numbers of both unstimulated and stimulated regions (e.g., for H3K4me1, 72.0% and 67.4%). (D–G) Percentages in red are relative to the TF (e.g., in E, 32.7% of IFNG-stimulated STAT1 binding sites are associated with H3K4me1 and not H3K4me3), while those in blue and green are relative to H3K4me1 and H3K4me3, respectively, and refer to modified regions that are not associated with the TF (e.g., in E, 7.1% of the H3K4me1 regions that are not associated with STAT1 are associated with H3K4me3).


