
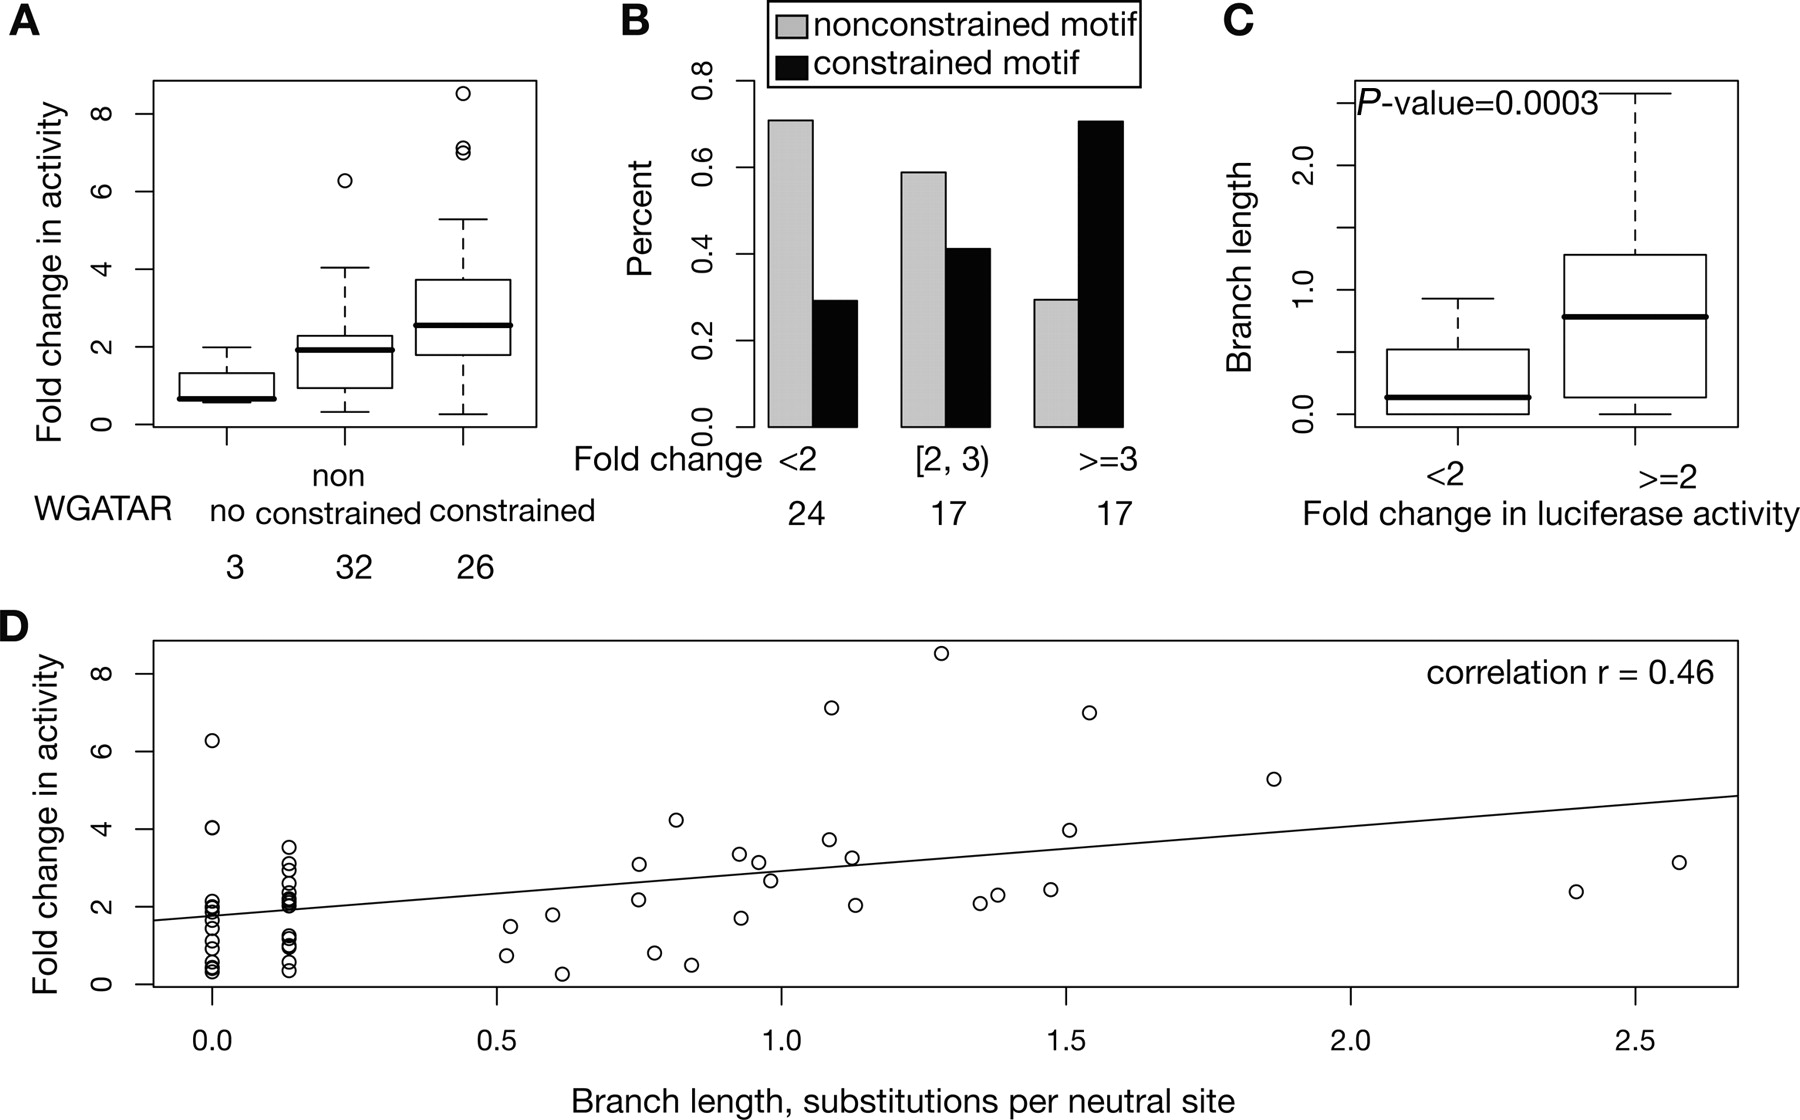
Positive correlation of enhancer activity with constraint on GATA1 binding site motifs. (A) The range of enhancer activities as box plots for occupied segments partitioned by constraint on the GATA1 binding site motif. The total numbers of occupied DNA segments in each category are given at the bottom of A and B. (B) The fraction of occupied DNA segments with constrained (black bars) or nonconstrained (gray bars) binding site motifs in classes of increasing enhancer activity. (C) The distribution of branch lengths over which the binding site motif is preserved for intervals without or with enhancer activity. (D) The mean enhancer activity (fold change compared with that of the parental plasmid) of each occupied segment as a function of branch length over which the motif resists alteration to remain a match to WGATAR. The P-values evaluate the null hypothesis of equal means in a one-tailed, two-sample Student’s t-test.


