
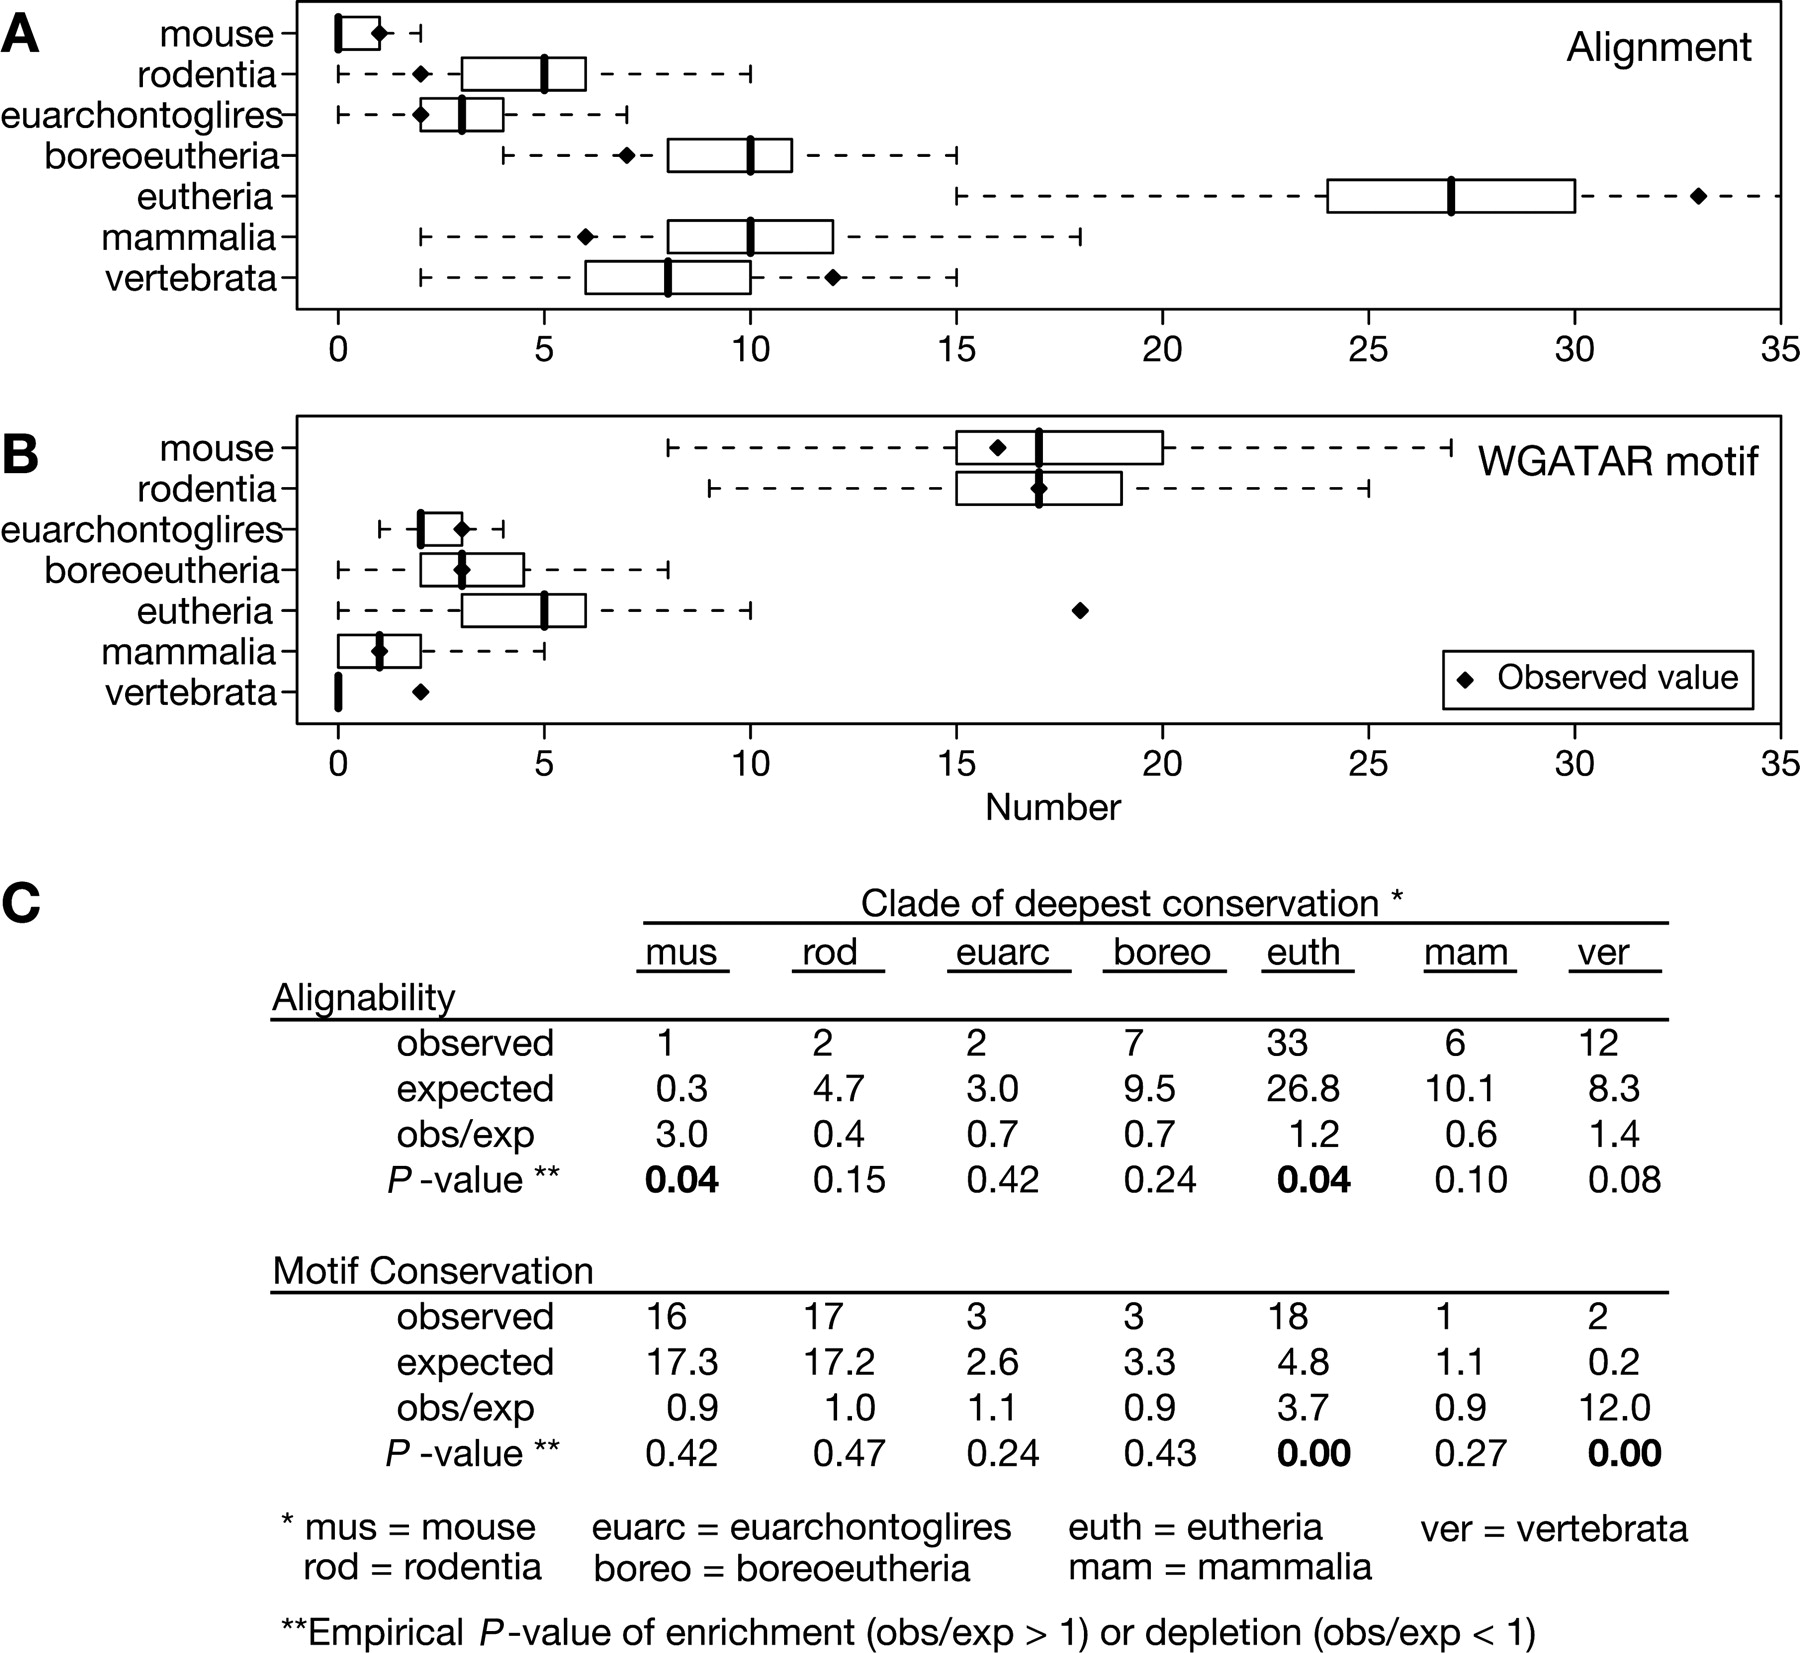
Conservation of the DNA segments occupied by GATA1 and preservation of the GATA1 binding site motifs within those segments. The 63 GATA1 occupied segments were classified by phylogenetic conservation of sequence (A) and preservation of WGATAR motifs (B), i.e., the motif aligns to the designated clade and still retains a match to WGATAR. Solid diamonds represent the observed number of occupied segments showing conservation of the DNA segments or preservation of the WGATAR motif in the designated clade but no further. The distributions of the same classification found in 1000 iterations of randomly sampling 63 DNA intervals from the nonrepetitive portions of the 66-Mb target region are shown as box plots. The box line is the median, box width is the interquartile range, and whiskers extend to the most extreme data point that is no more than 1.5 times the interquartile range. (C) The observed and expected frequencies of conservation. The mean number of times that a designated clade of deepest conservation is found in the 1000 random samplings is taken as an estimate of the expected value. The ratio of the observed to expected number of times that a given extent of conservation is seen indicates the level of enrichment (ratio > 1) or depletion (ratio < 1). Comparison of the observed value to the distribution of values for the random samplings gives the associated empirical P-values for enrichment or depletion; the P-values < 0.05 are in boldface type.


