
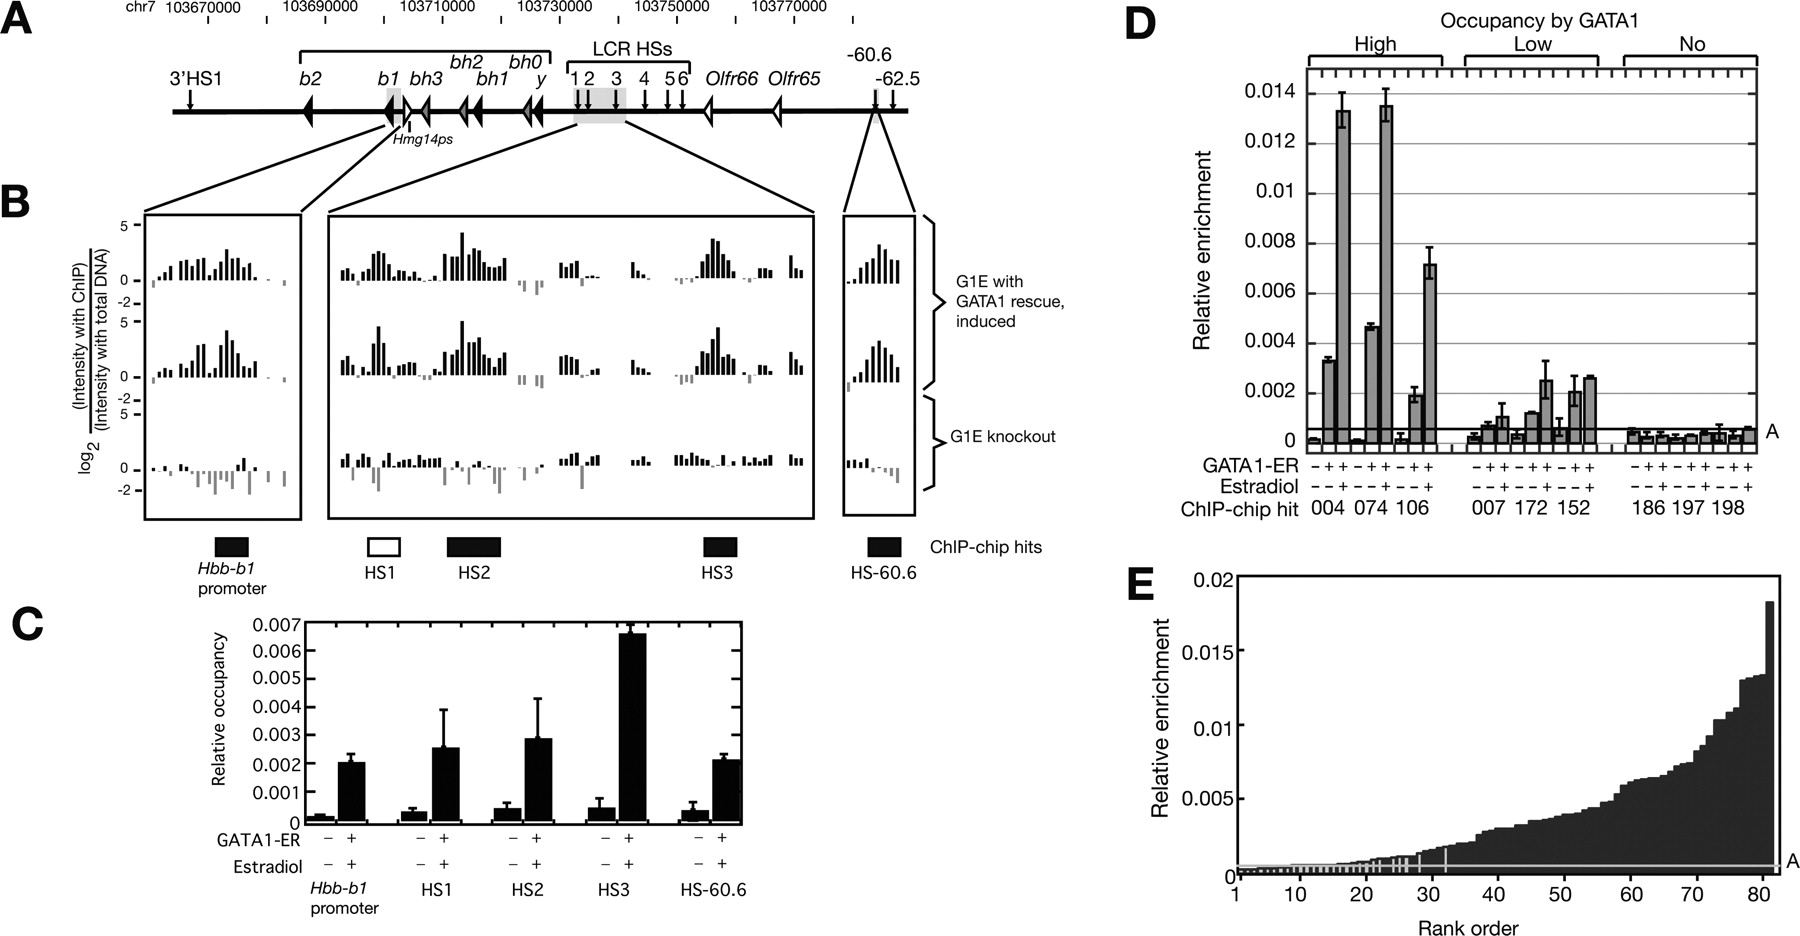
Occupancy by GATA1: ChIP-chip and qPCR data. (A–C) Sensitivity and specificity of the ChIP-chip data in the Hbb gene cluster. (A) Location of genes and DNase hypersensitive sites in the mouse Hbb gene cluster. (B) ChIP-chip results for GATA1 in the mouse Hbb gene cluster. The first two tracks present the logarithm of the ratio of hybridization intensities between ChIP DNA from G1E ER rescued cell line and the input DNA for two replicates. The third track shows the hybridization signals from the G1E Gata1-null cell. The boxes beneath these tracks show intervals previously identified as bound by GATA1; the boxes are black if they are included in the ChIP-chip peak calls or white if not included. (C) The quantitative PCR results of the previously identified segments occupied by GATA1. The two bars are the qPCR result with ChIP material from G1E cells and from rescued G1E ER4 cells. The mean of two determinations is plotted, and the error bars are half of the range. (D,E) Independent validation of the GATA1 ChIP-chip results by qPCR. (D) DNA segments positive in the ChIP-chip assay shown by qPCR to have high, low, and no occupancy by GATA1. Amplicons for each ChIP-chip hit were assayed in GATA1–ER ChIP material from G1E knockout cells (first bar in each set) and from G1E–ER4 cells before and after induction of the GATA1–ER hybrid with estradiol (second and third bar). The mean of the two determinations is graphed, with half the range shown as error bars. Relative enrichment is the ratio between the amount of the amplicon immunoprecipitated along with GATA1 and the amount of the amplicon in the input material. Line A is drawn at the mean relative enrichment of the negative controls plus three standard deviations. (E) The relative enrichment in ChIP material from induced G1E–ER4 cells for 81 high-stringency ChIP-chip hits tested by qPCR. The black bars are the DNA intervals that not only pass the mean plus three standard deviations of the negative controls set but also show at least a fourfold increase in enrichment compared with the signals from the Gata1-null cells. The gray bars are the ChIP-chip hits that did not pass one or both of the above thresholds. Line A is the same as in D.


