
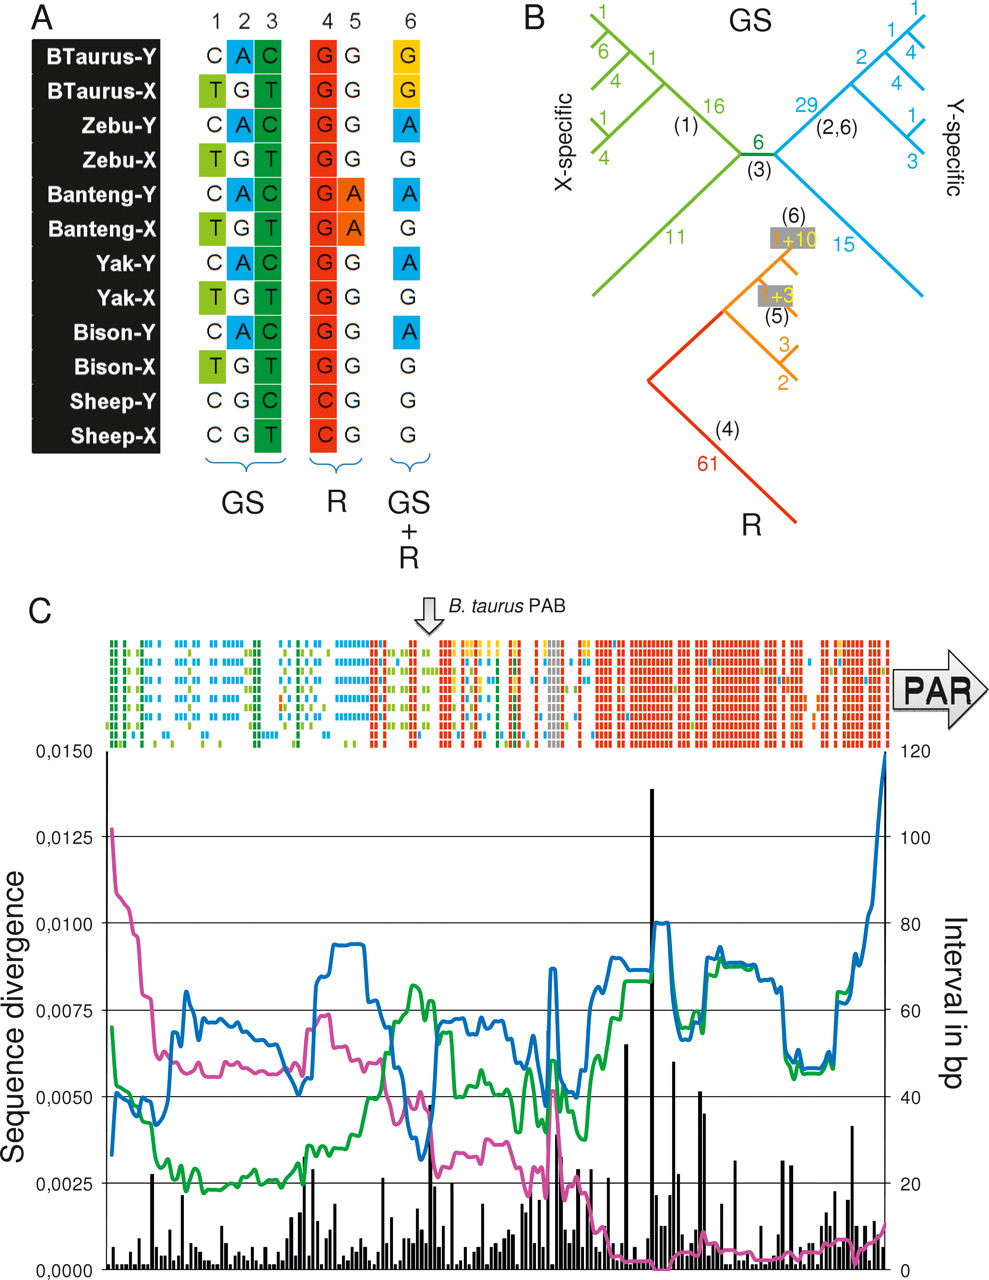
Comparative sequence analysis of the PAB in sheep and Bovinae (Bovine, Zebu, Banteng, Yak, and Bison), focusing on the 413 bp of reduced homology and 1233 bp in the PAR. X- and Y-derived sequences were aligned using ClustalW, and 181 variant sites were identified. (A) Examples of variant sites with color-labeled gonosome-specifying (GS) (green or blue) or recombinational (R) events (yellow, orange, or red). (1–3) GS events corresponding to: (1) a C to T transition on the X of the ancestor of Bovinae, (2) a G to A transition on the Y of the ancestor of Bovinae, and (3) a C to T transition on the X or Y of the ancestor of Bovinae and Caprinae. (4,5) R events corresponding to: (4) a C to G transversion and proximal X↔Y recombination having occurred on the red segment in the R-tree, (5) a G to A transition and proximal X↔Y recombination having occurred on the Banteng-specific branch in the R-tree. (6) Composite GS/R sites having undergone a G to A transition on the Y of the Bovinae ancestor and a X↔Y recombination on the cattle branch. (B) Tallying of the identified GS and R events on the known species tree (Hassanin and Ropiquet 2004). GS events are mapped on a tree distinguishing the X and Y chromosomes. R events are mapped on the species tree. The numbers of events mapped to a given branch are given. (Red and orange R numbers) Mutations that could not be assigned to the X or Y, (yellow R numbers) mutations with known gonosomal origin mapped on the GS tree (e.g., example 6). The numbers in parentheses correspond to the examples in A. (C) (Colored bars above the graph) Status of the six species (ordered vertically as in A) for the 181 variant sites. (Black vertical bars) Number of base pairs between adjacent sites with corresponding y-axis on the right. (Pink curve) Average within-species sequence divergence (average of moving 100-bp window) between the X- and Y-derived sequences. (Blue curve) Average sequence divergence for the Y-derived sequence of sheep versus the five Bovinae (average of moving 100-bp window). (Green curve) Average sequence divergence for the X-derived sequence of sheep versus the five Bovinae (average of moving 100-bp window). (Arrows) Positions of the B. taurus PAB and the PAR.


