
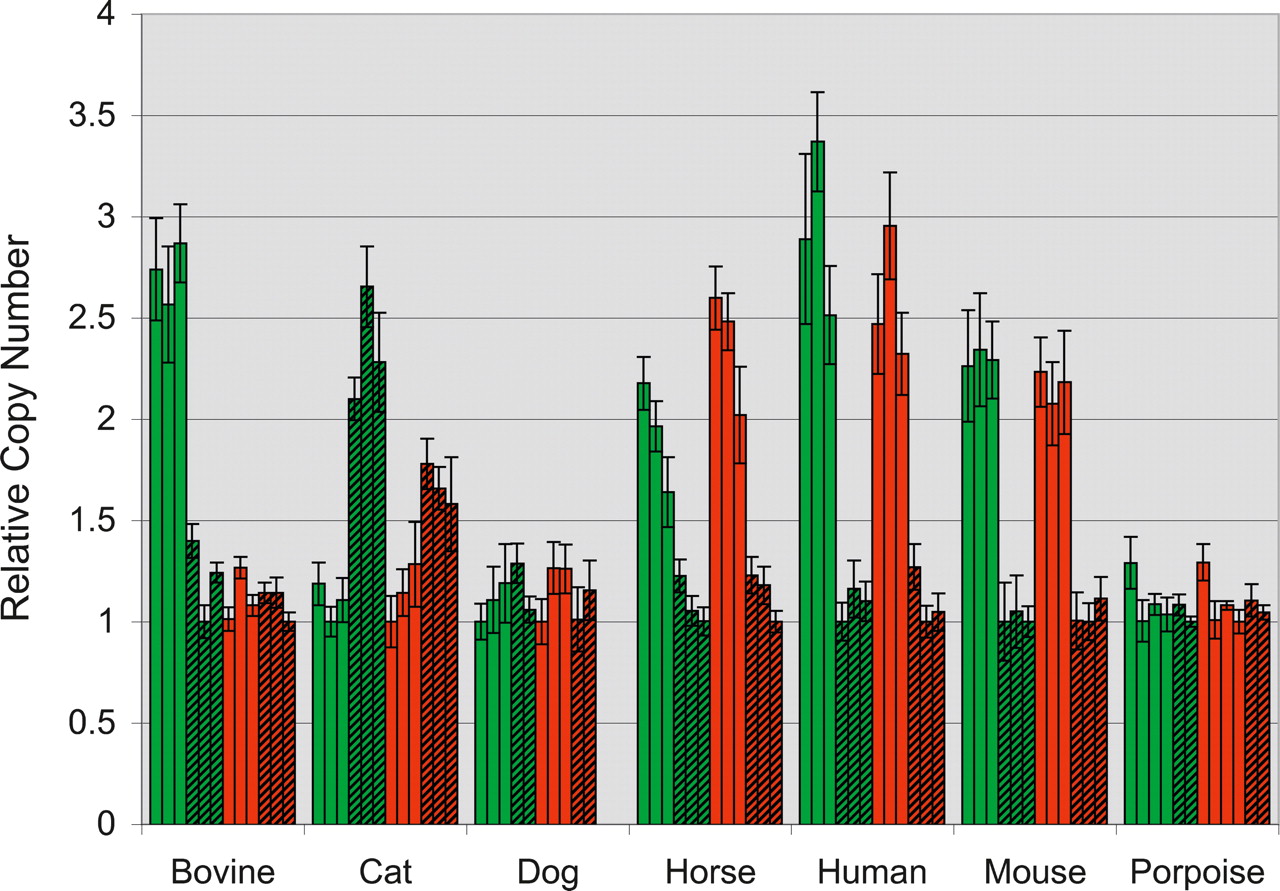
Figure 5.
Relative copy numbers of the SHROOM2 (green) and GPR143 (red) genes in females (plain) and males (hatched) of different mammalian species determined by quantitative PCR. Each bar corresponds to one individual. Error bars correspond to the standard deviation over three replicates.


