
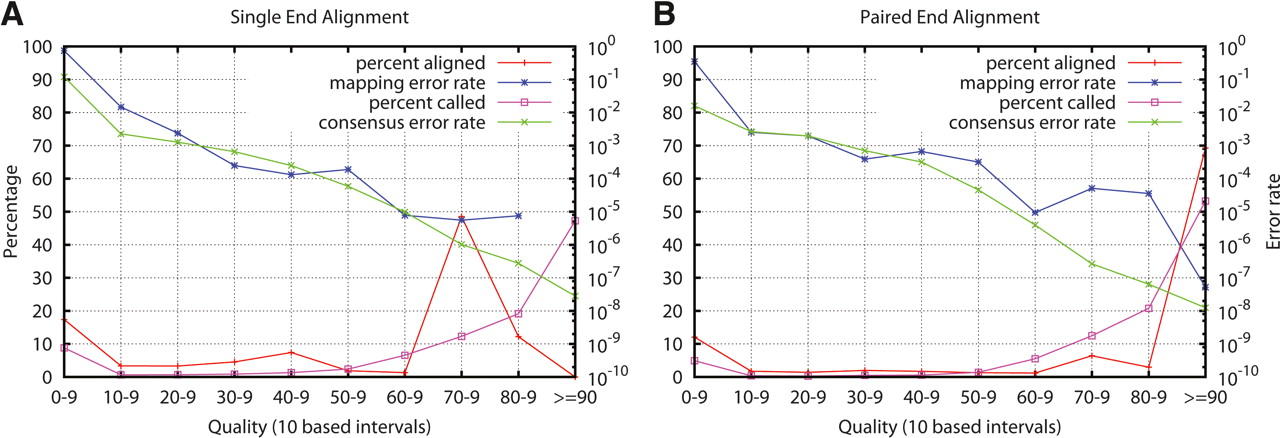
Distribution of mapping qualities, consensus qualities, true alignment error rate, and true consensus error rate. The red line shows the fraction of reads whose mapping qualities fall in each interval. (Pink line) The fraction of consensus genotypes whose consensus qualities fall in each interval; (blue line) the true alignment error rate of reads in each interval; (green line) the true consensus error rate of reads in each interval. (A) Reads are aligned without using mate-pair information. Single-end alignments do not contain enough information for MAQ to assign mapping quality larger than 90; therefore, the data in the top bin are missing. (B) Reads are aligned using mate-pair information.


