
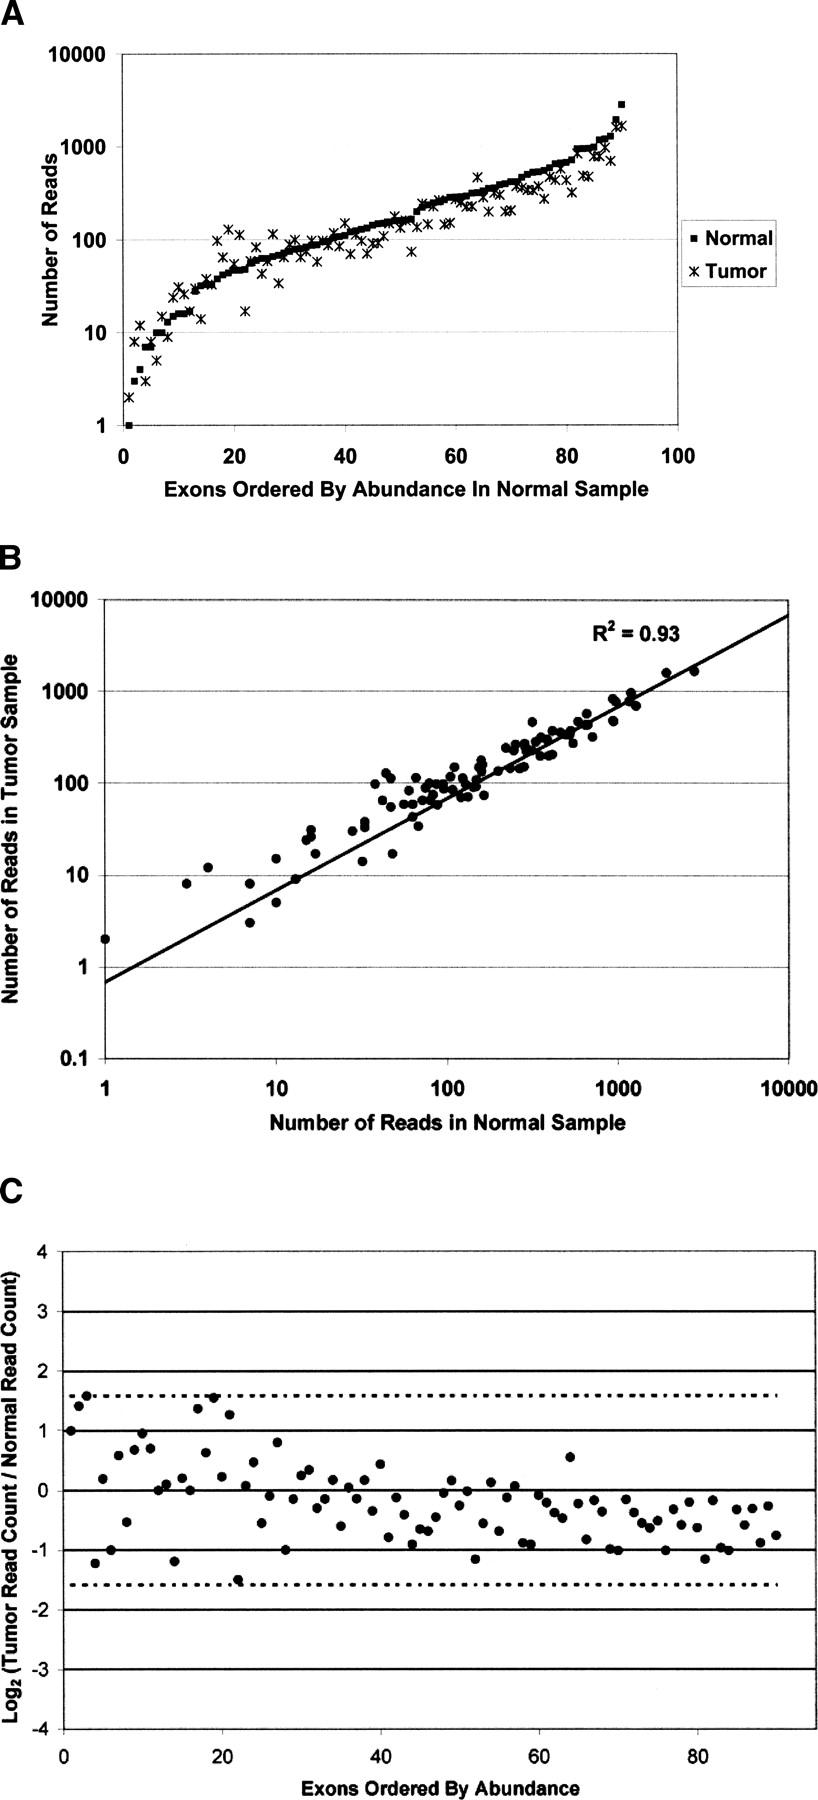
Quantification of the abundance and reproducibility of Nested Patch PCR per exon in each sample. (A) Uniform exon abundance. Graph of the number of reads obtained for each targeted exon from the colon cancer sample and adjacent normal tissue. The 90 exons for which we obtained at least one read are ordered by abundance in the normal sample on the x-axis. The median number of reads per exon is 145. Seventy-six percent of all exons fell within fivefold coverage of this median. All exons are within 3 log10 of each other. (B) Correlation of number of reads across samples. Each exon is depicted as a point on the graph, where the x-axis is the number of reads in the normal sample and the y-axis is the number of reads in the colon cancer sample. The correlation was high (R2 of 93%), indicating high reproducibility across samples. (C) Fold difference in abundance across samples. We computed the fold change of abundance per exon between the two samples. 85% (77/90) of exons displayed a twofold or less difference in abundance between samples. One hundred percent of exons displayed a threefold or less difference in abundance between samples. Dotted line indicates threefold change [log2(3)].


