
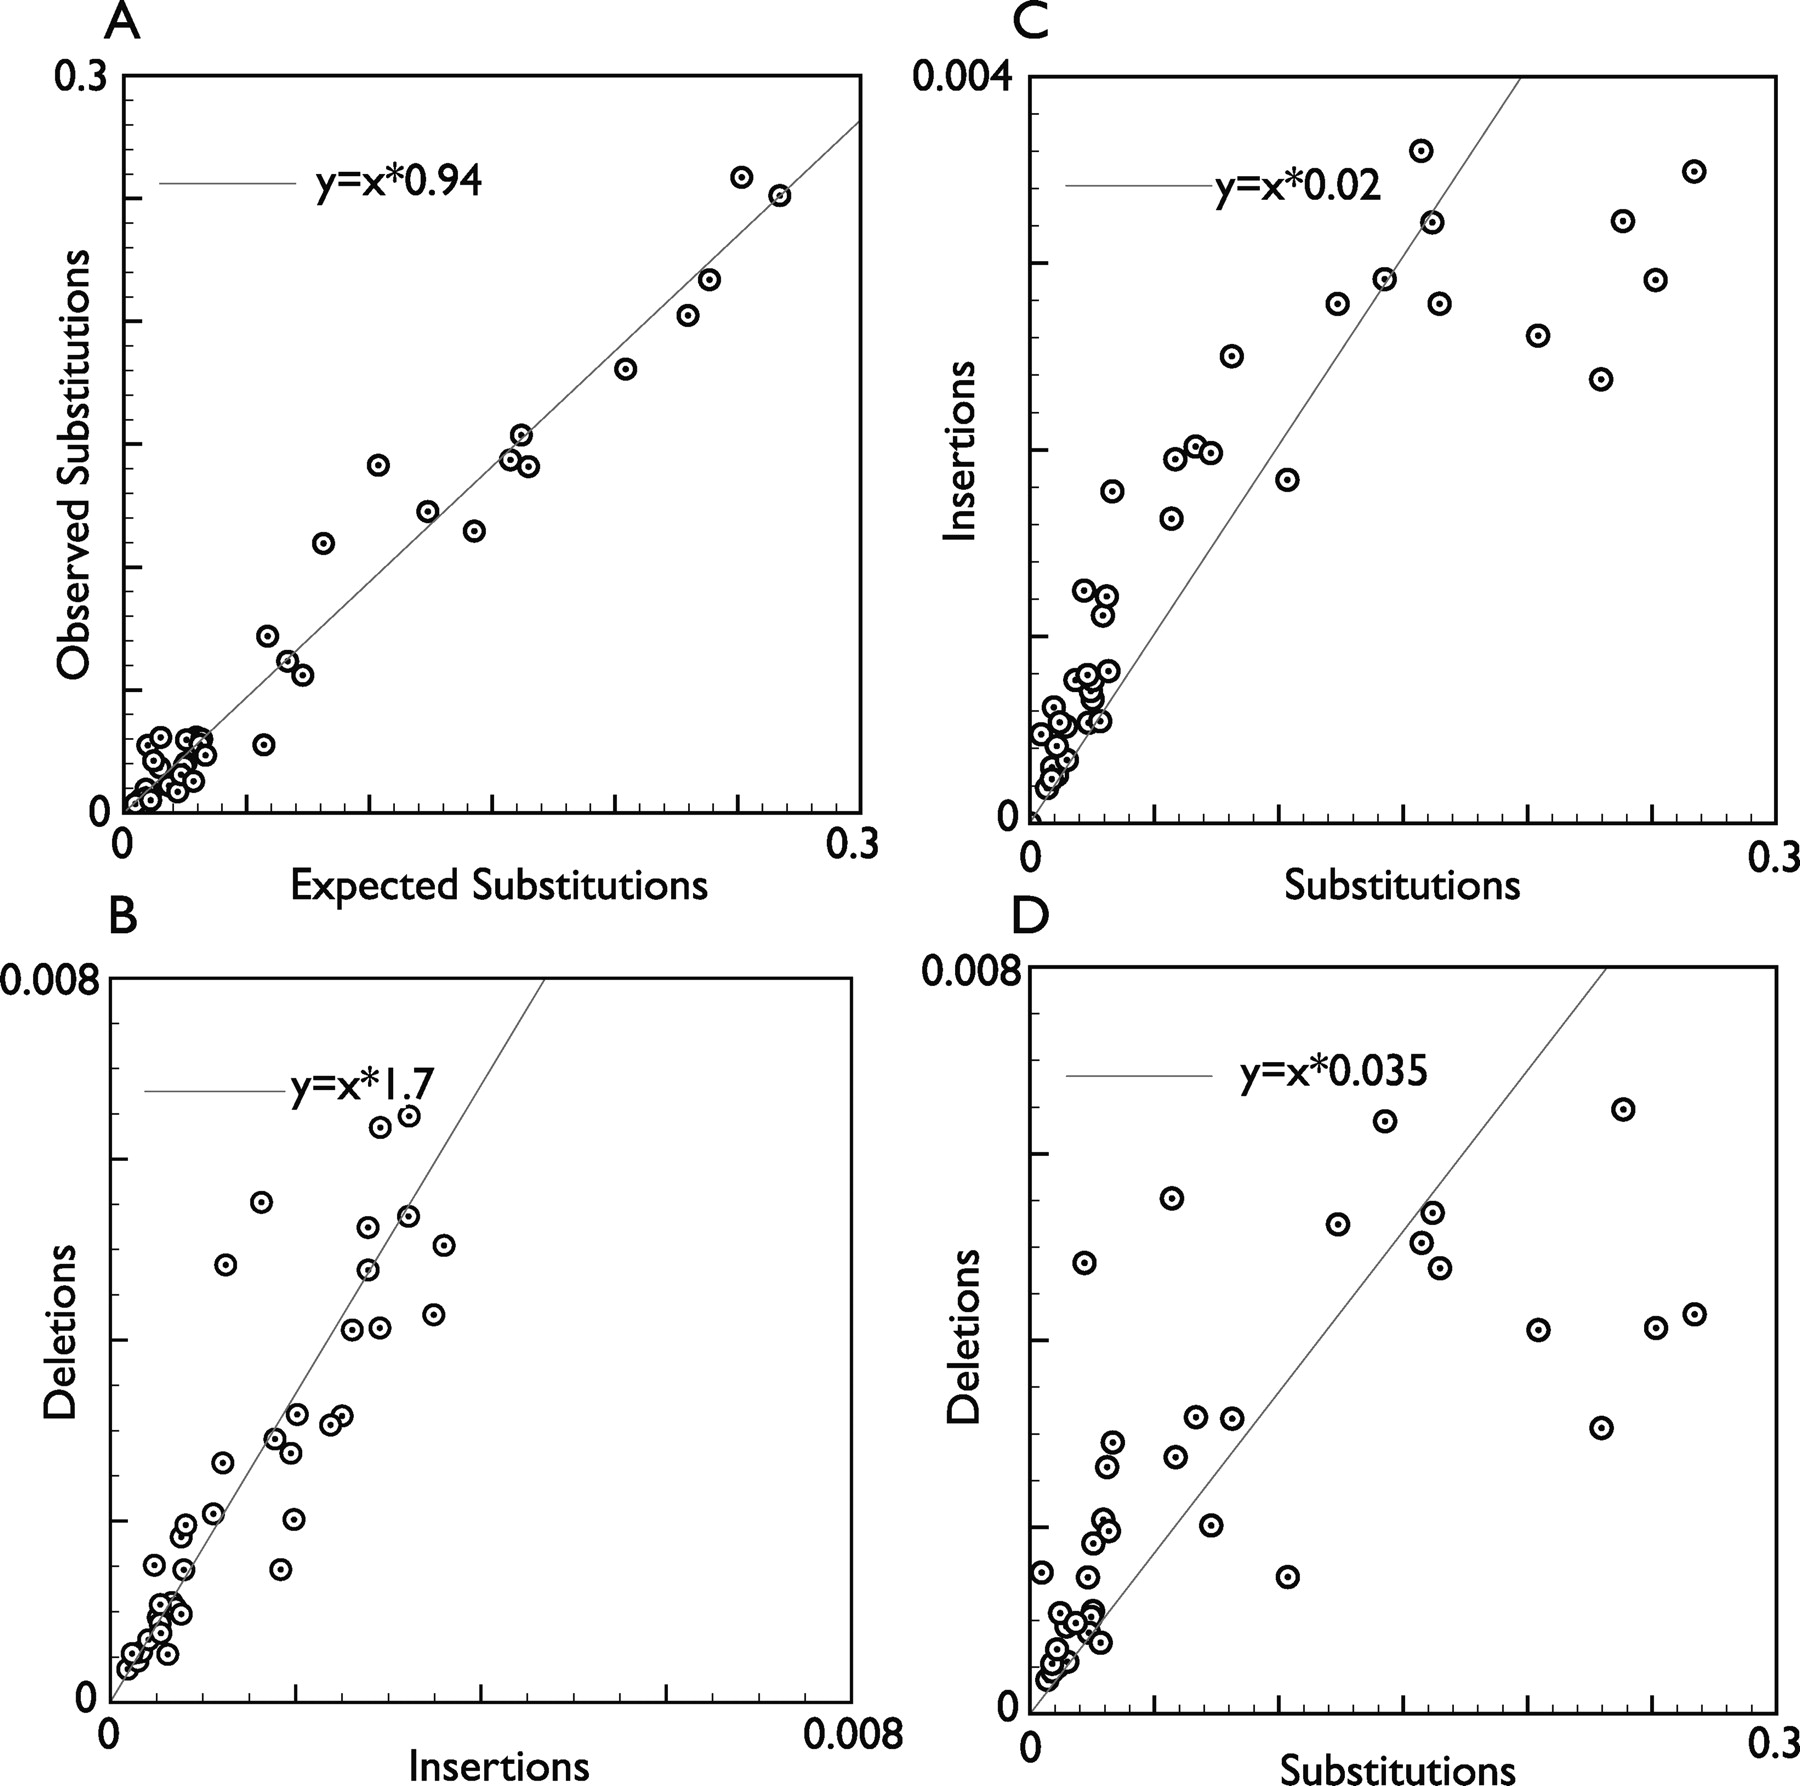
Figure 9.
Observed insertion, deletion, and substitution rates. Scatterplots showing expected versus observed substitutions (A), insertions versus deletions (B), insertions versus expected substitutions (C), and deletions versus expected substitutions for all the branches in the phylogeny, excluding the three branches emanating from the root sequence, where measurements are likely to be very imprecise (D). Linear regression lines are shown estimating the overall ratios.


