
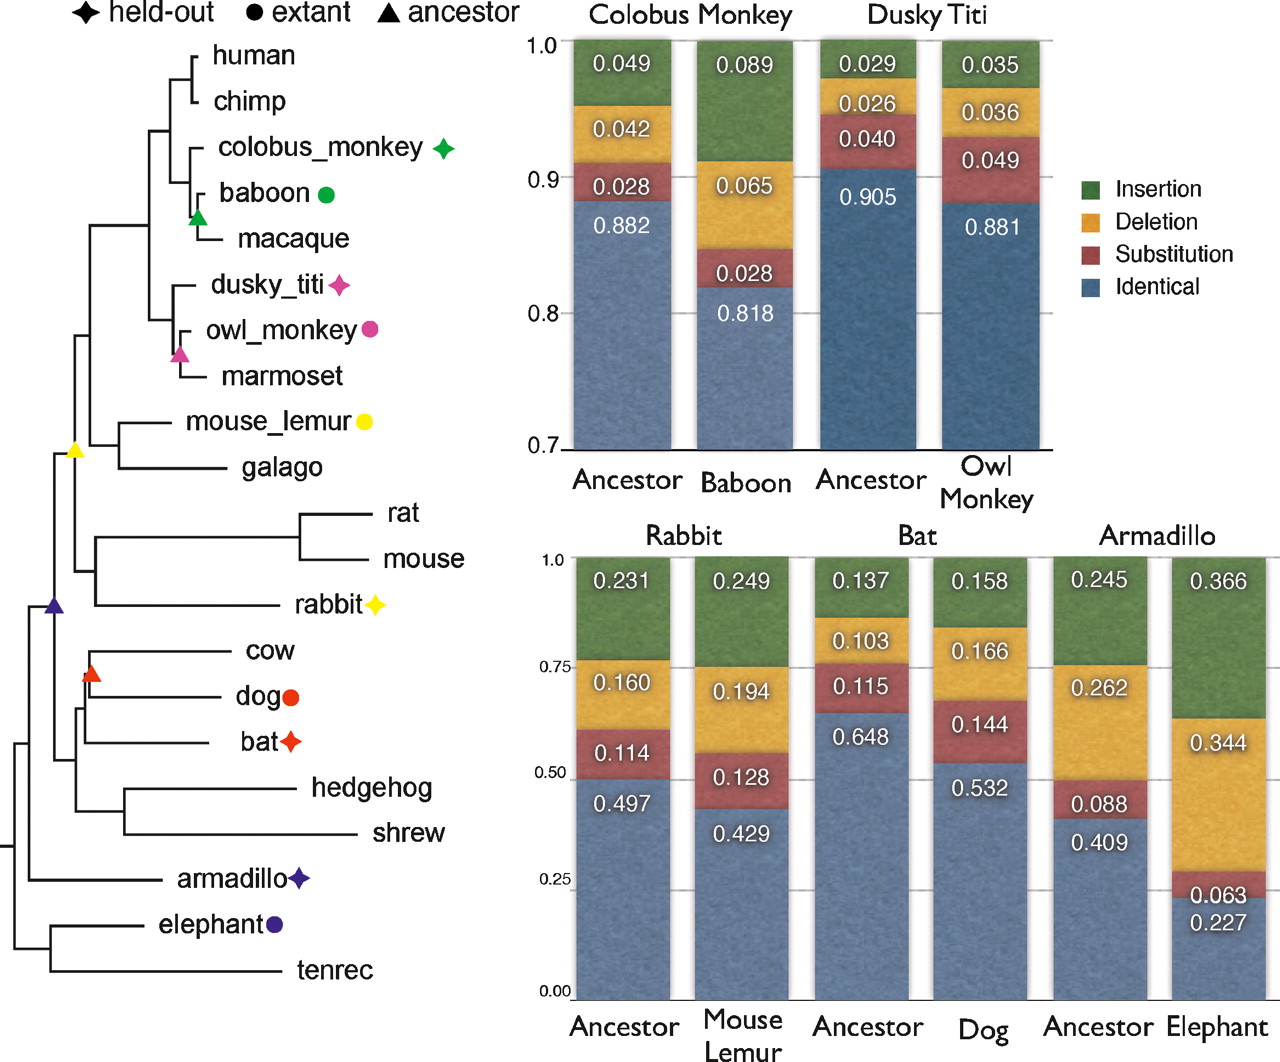
Figure 8.
Hold-one-out cross-validation experiments. (Left) Tree showing species held out, their closest extant relative, and the internal nodes from which the ML ancestor predictions were derived. (Right) Histograms showing the proportions of bases in the held-out species substituted, deleted, inserted, or correctly predicted by the extant and ancestor sequences.


