
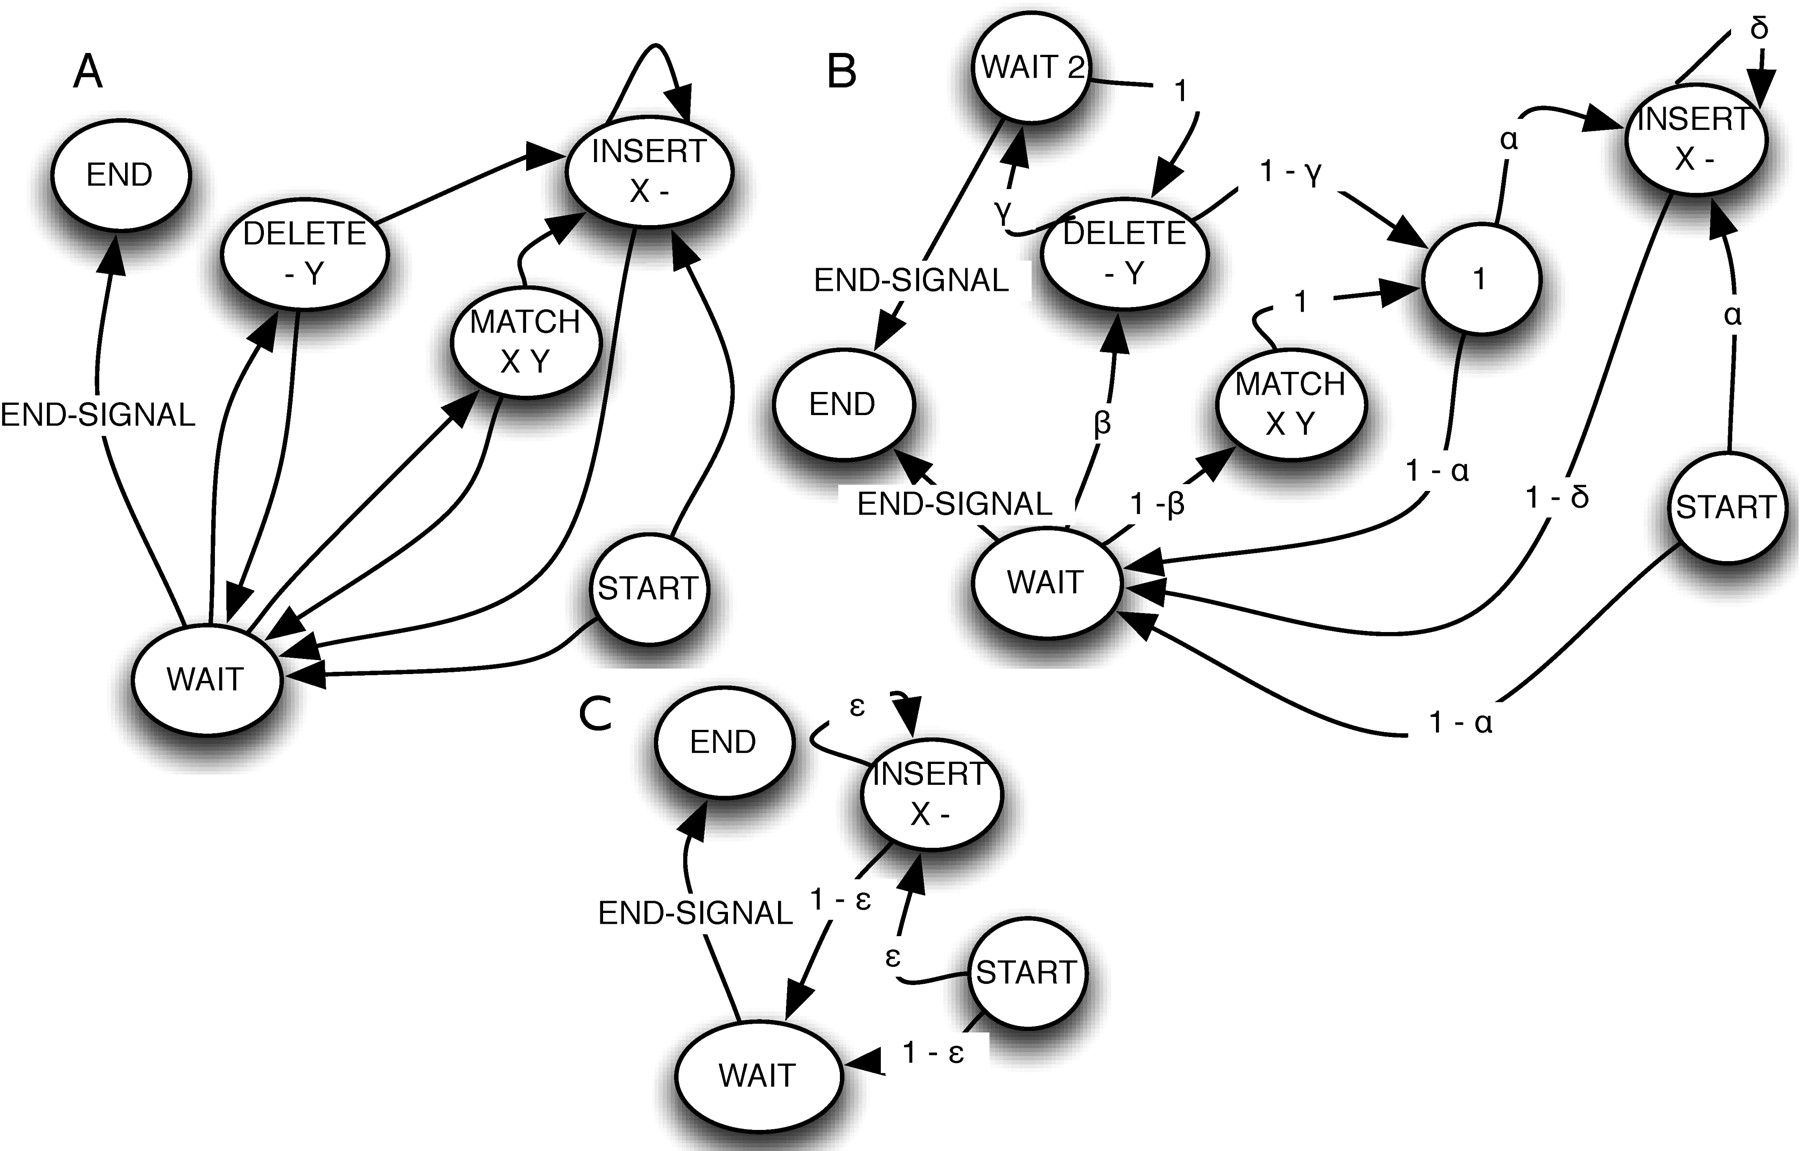
Figure 2.
Branch transducers and sequence graphs. State diagrams showing transducers. (A) A simple branch transducer. The START, END, WAIT, and unlabeled states are silent states. Emissions are labeled beneath the state name. Output emissions to the descendant sequence are labeled X, and input symbols from the ancestor are labeled Y; gaps are labeled “–”. (B) An affine branch transducer with labeled transition parameters. (C) Root branch transducer with labeled transition parameters.


