
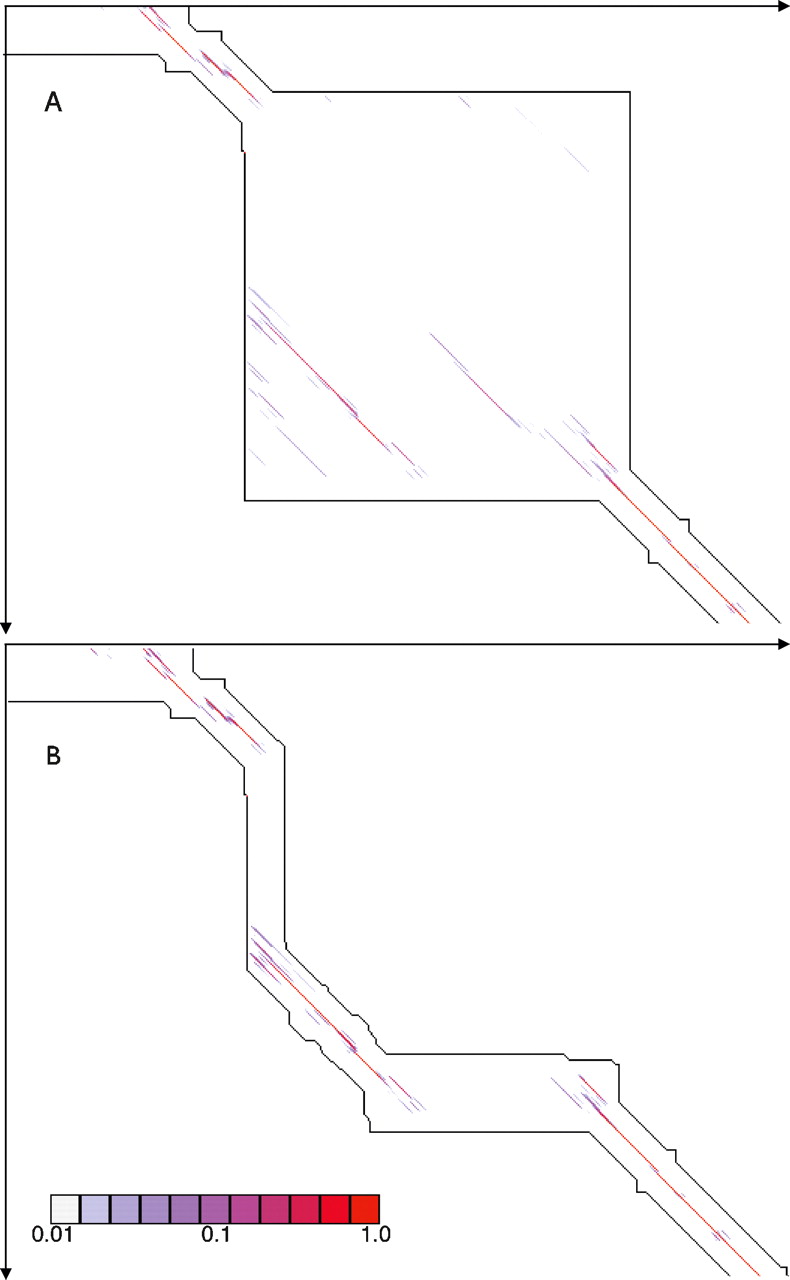
Figure 4.
(A) An edit-graph showing an alignment band generated without transitive anchors. Alignment pairs whose posterior probability is between 0.01 and 1.0 are plotted, colored according to their probability. (B) An edit-graph showing the alignment band for the same region as in A, but with transitive anchors. Certain edges are now excluded from the alignment, but the majority of the probability is well enveloped.


