
Table 1.
Overview about detected miRNA/miRNA* species, expression range and distribution
Click on table to view larger version.
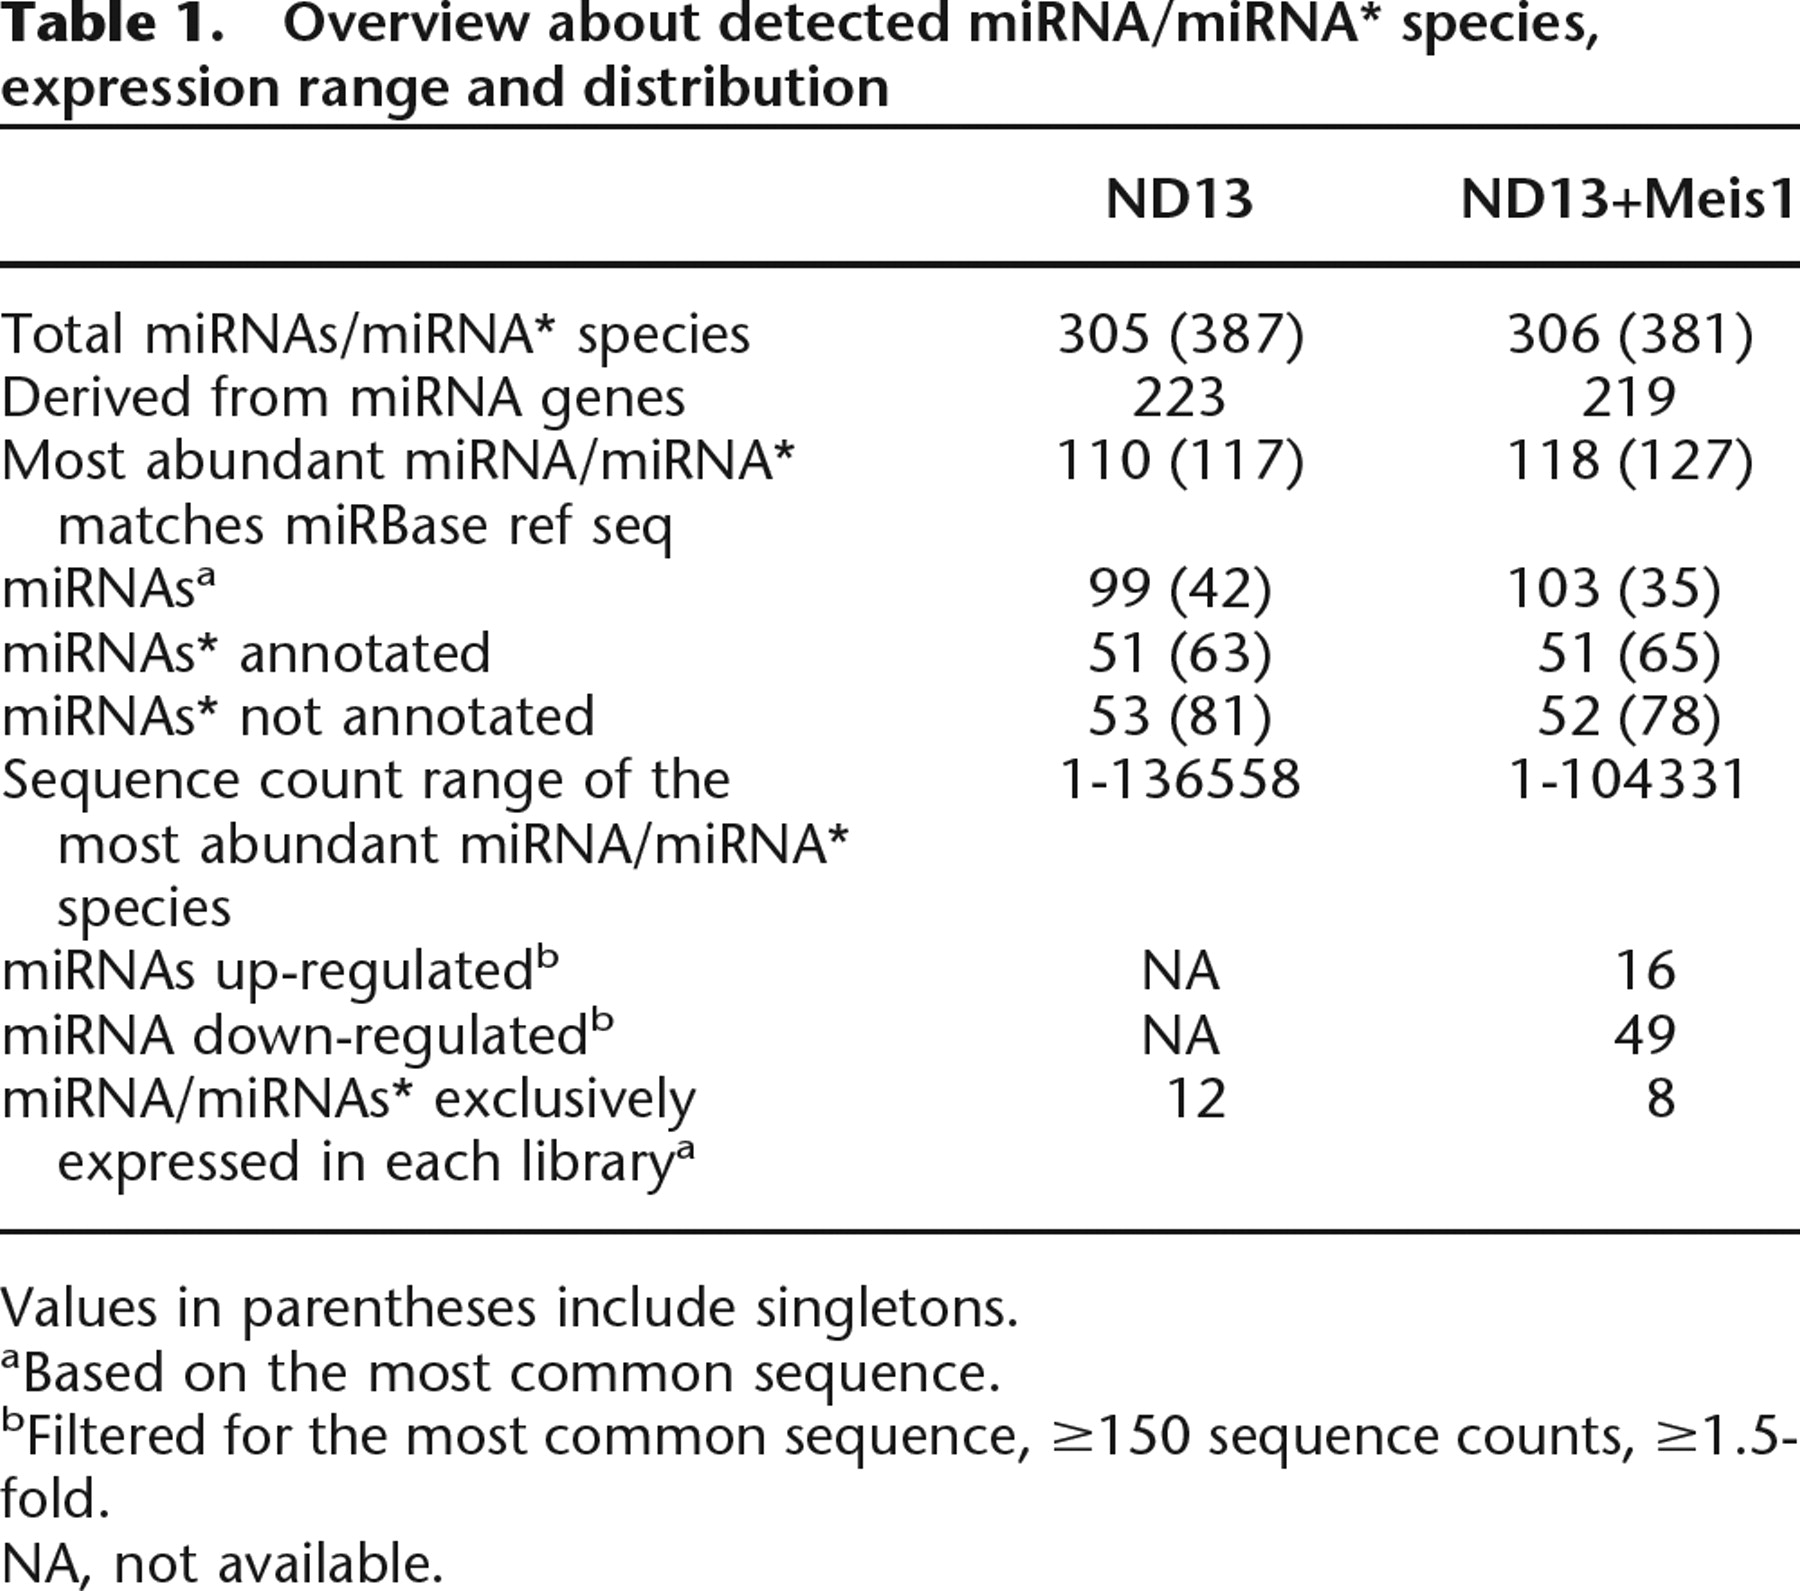
Values in parentheses include singletons.
aBased on the most common sequence.
bFiltered for the most common sequence, ≥150 sequence counts, ≥1.5-fold.
NA, not available.


