
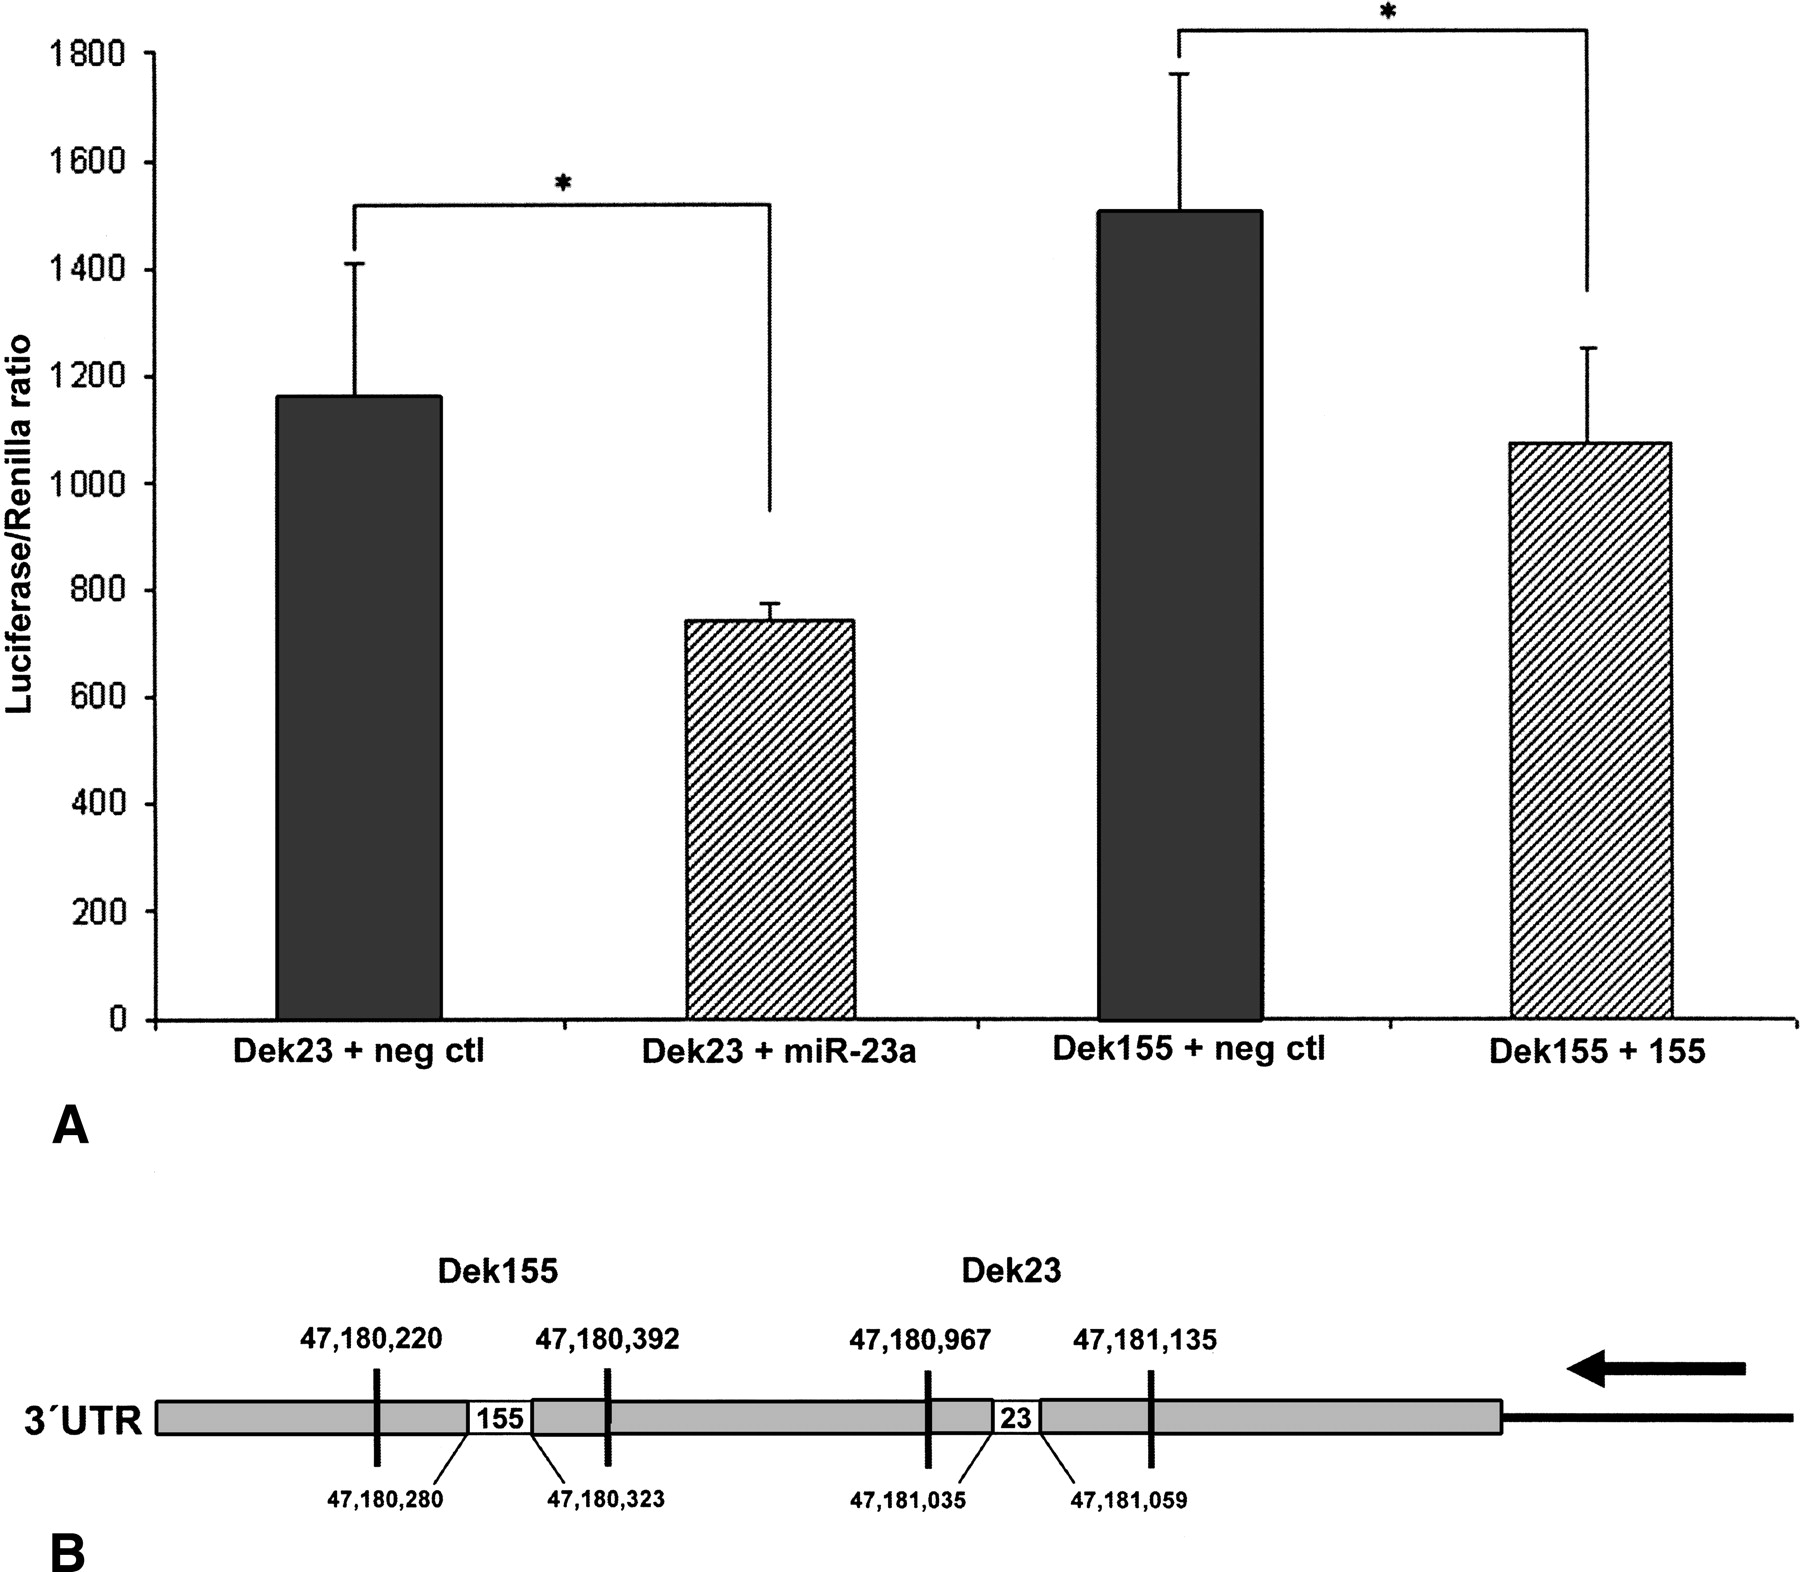
Figure 5.
Dek-3′ UTR luciferase assays for miR-23a and miR-155. (A) Bar diagram demonstrating the binding of miR-23a and miR-155 to the 3′ UTR of the Dek oncogene. Dek23 comprises only binding sites for miR-23a, whereas Dek155 exhibits only predicted binding sites for miR-155. A nonbinding miRNA was used as negative control. *P < 0.05. (B) Schematic representation of the Dek 3′ UTR constructs and the predicted miRNA binding sites.


