
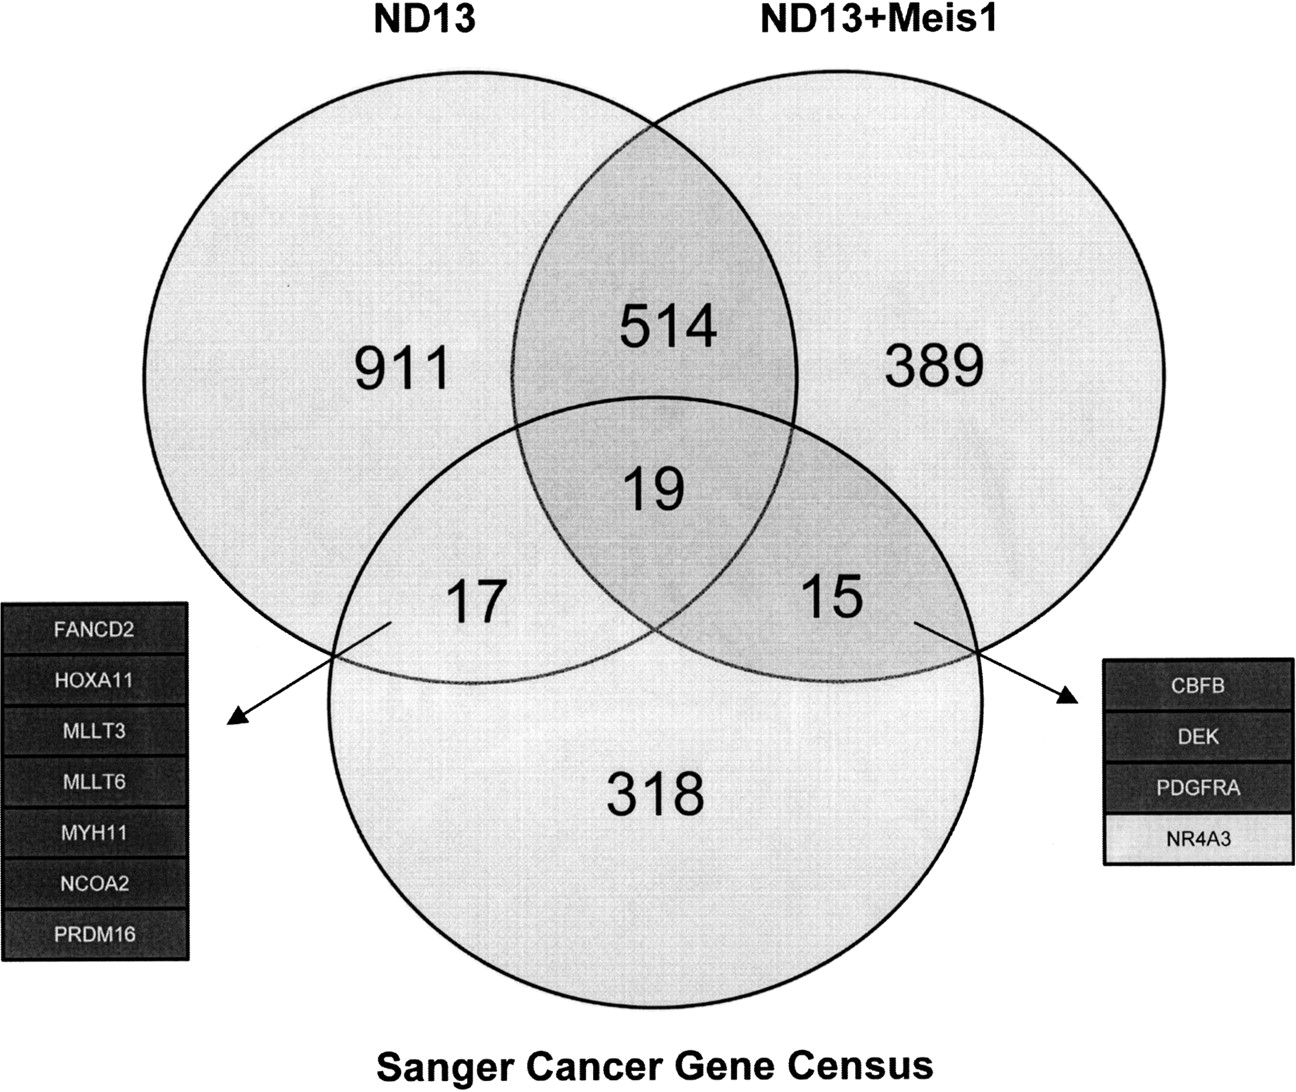
Figure 4.
Venn diagram of the predicted miRNA targets for the 19 most abundant miRNAs from each library and their shared targets with the Sanger Cancer Gene Census. The dark boxes indicate AML-specific oncogenes, whereas the gray box highlights a tumor suppressor gene targeted by miRNAs enriched in ND13+Meis1 cells.


