
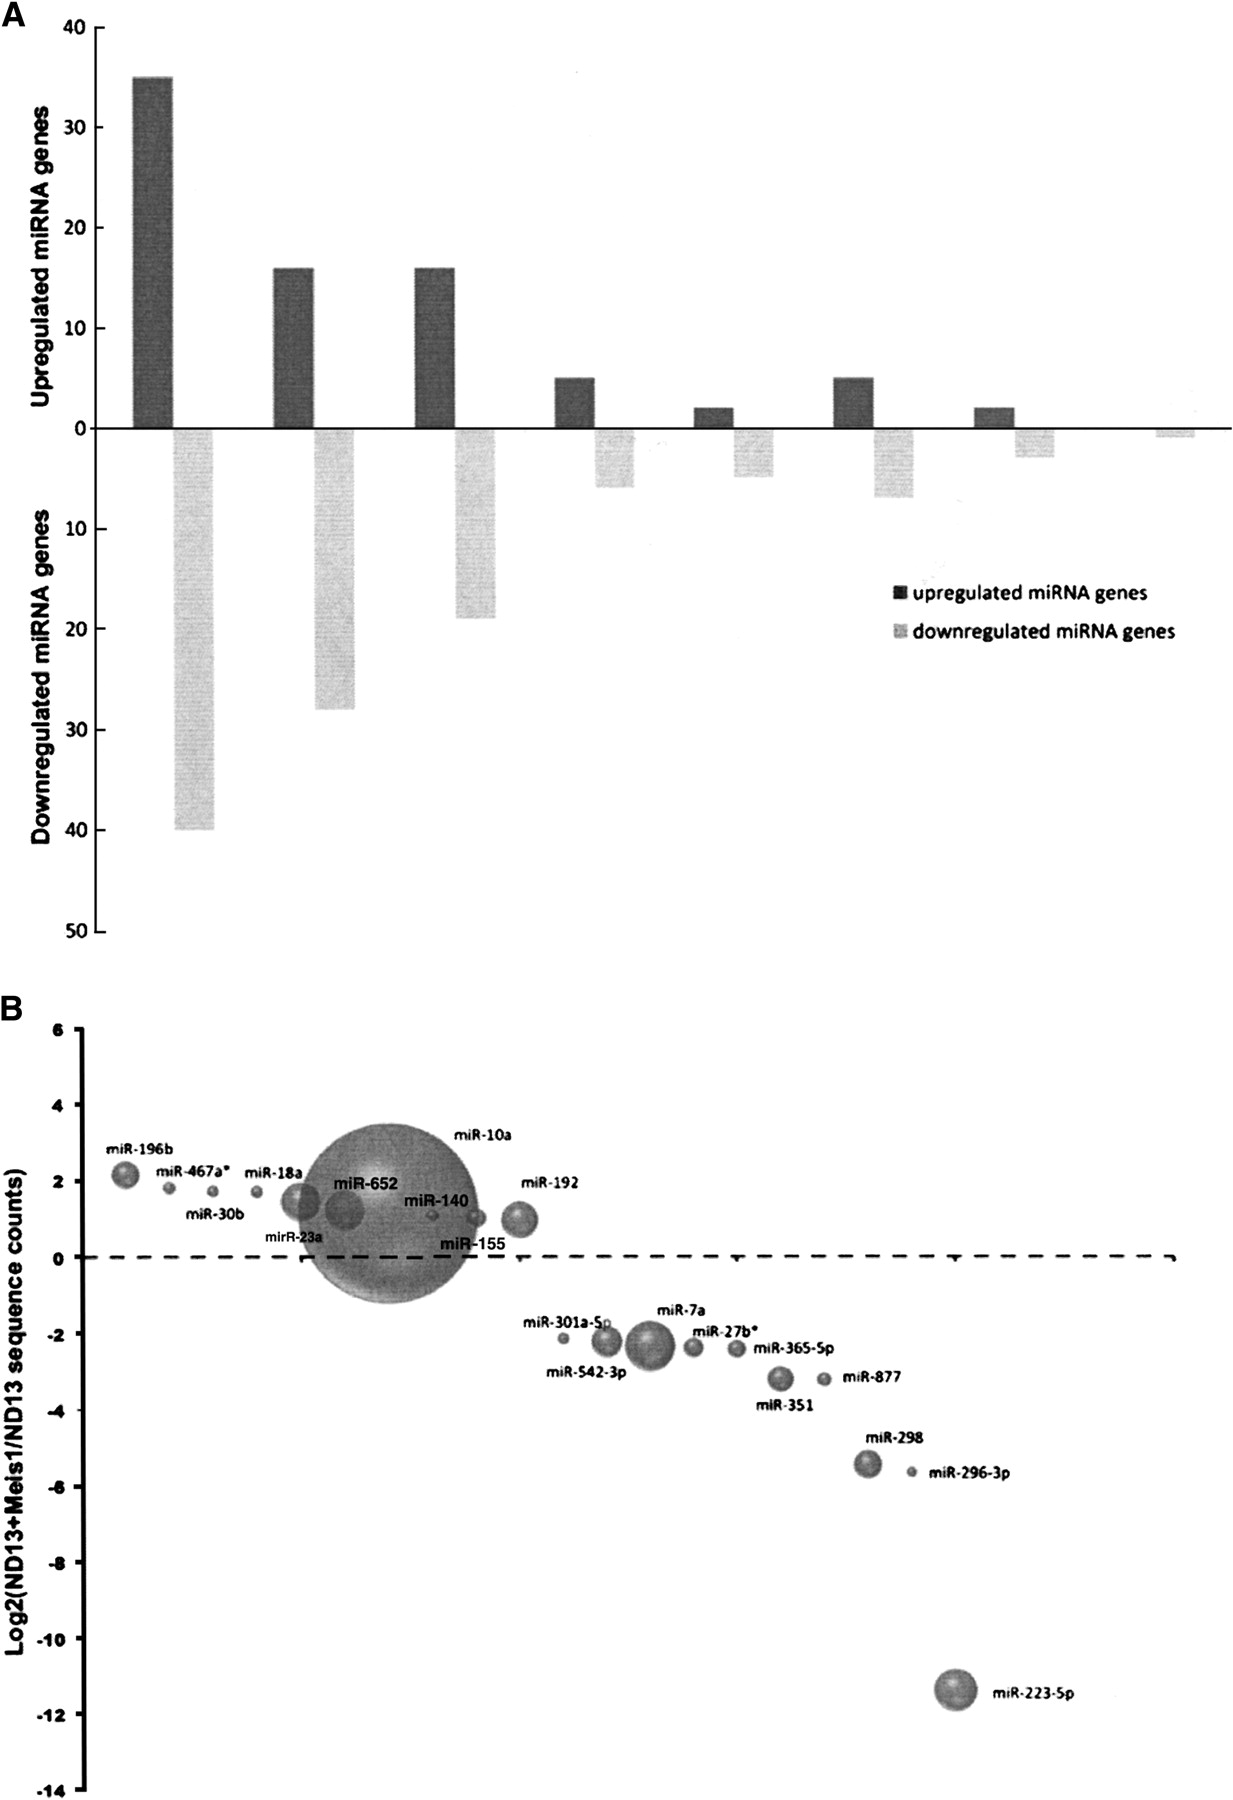
Analysis of differentially-expressed miRNA genes in leukemic cells compared with preleukemic cells. (A) Distribution of differentially-expressed miRNA genes according to their fold changes. Shown are the number of miRNA genes whose expression was up-regulated (positive values) or down-regulated (negative values) in the leukemic cells as a function of the fold change. Only changes >1.5 and achieving a P-value of <0.05 were included. (B) Bubble plot depicting the abundance of selected miRNA/miRNA* species and their relative expression levels. The bubbles represent the sum of the most common sequence counts from both libraries for a miRNA/miRNA* species plotted as a function of fold difference between the leukemic versus preleukemic cells.


