
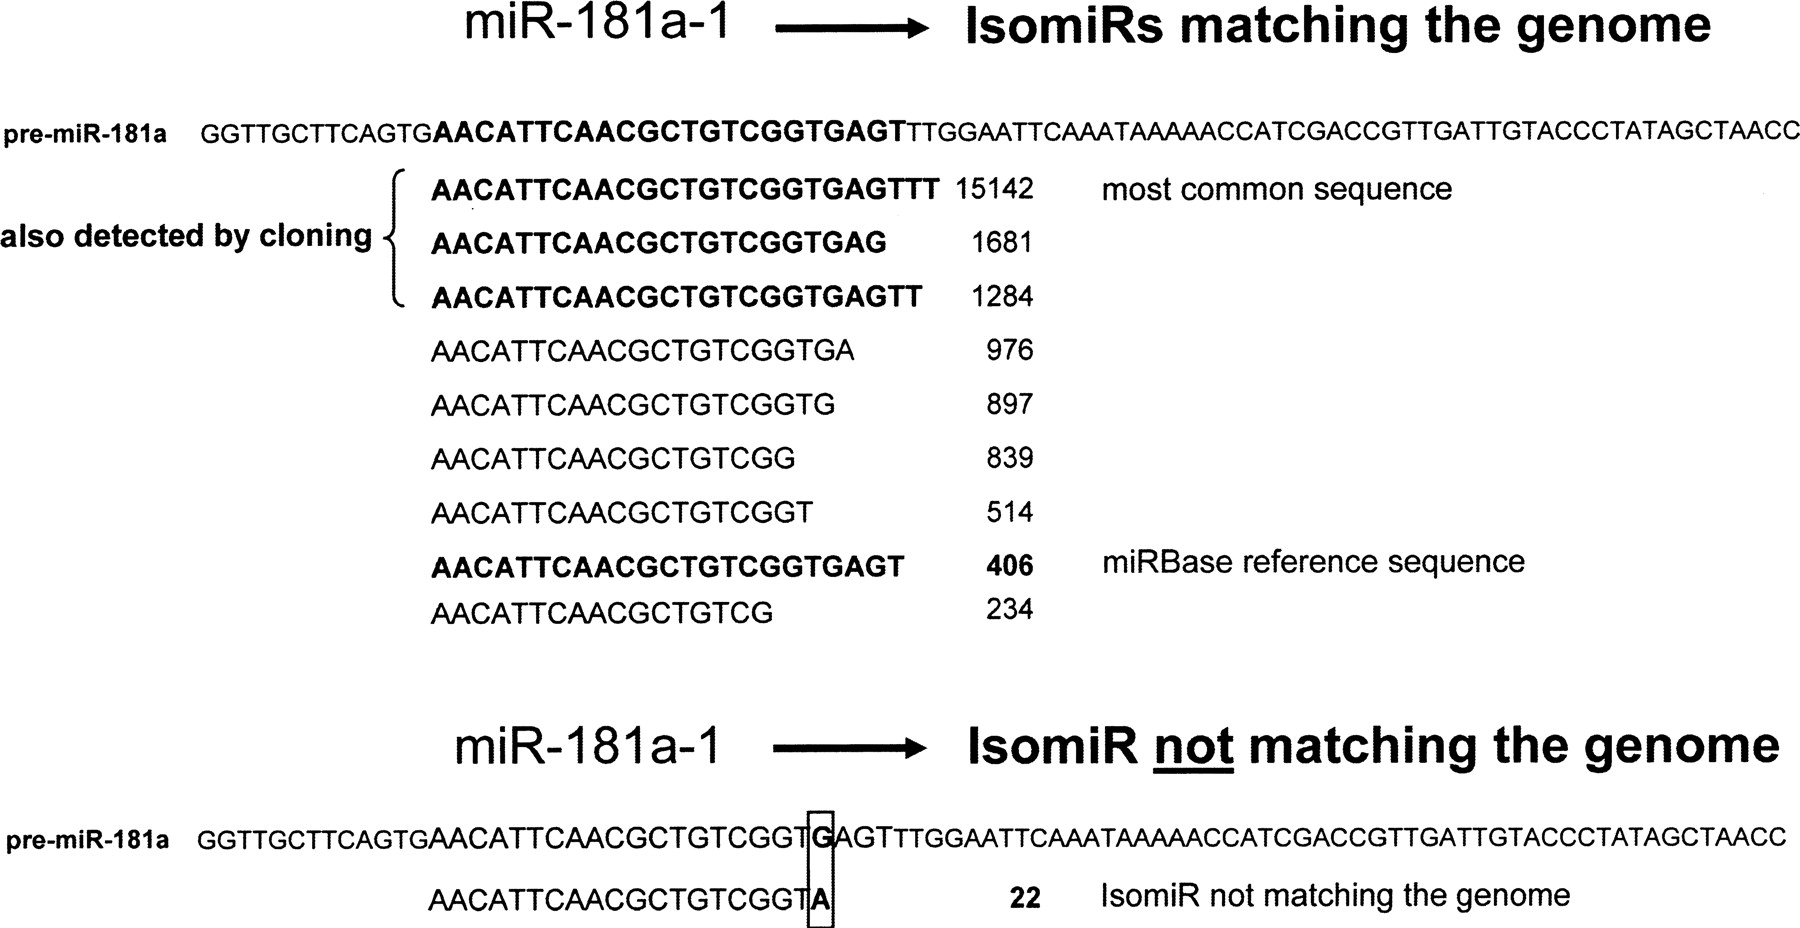
Figure 2.
Example of high frequency of miRNA sequence variation (isomiRs). Shown are the unique sequences and number of times this sequence was detected matching the pre-miRNA sequence of miR-181a. The most frequent occurring miR-181a sequence is not in accordance with the miRBase reference sequence. The three most common sequences were also detectable by linker-based cloning, as indicated in the figure. An example of a miR-181 isomiR not matching the genome is shown in the bottom part of the figure.


