
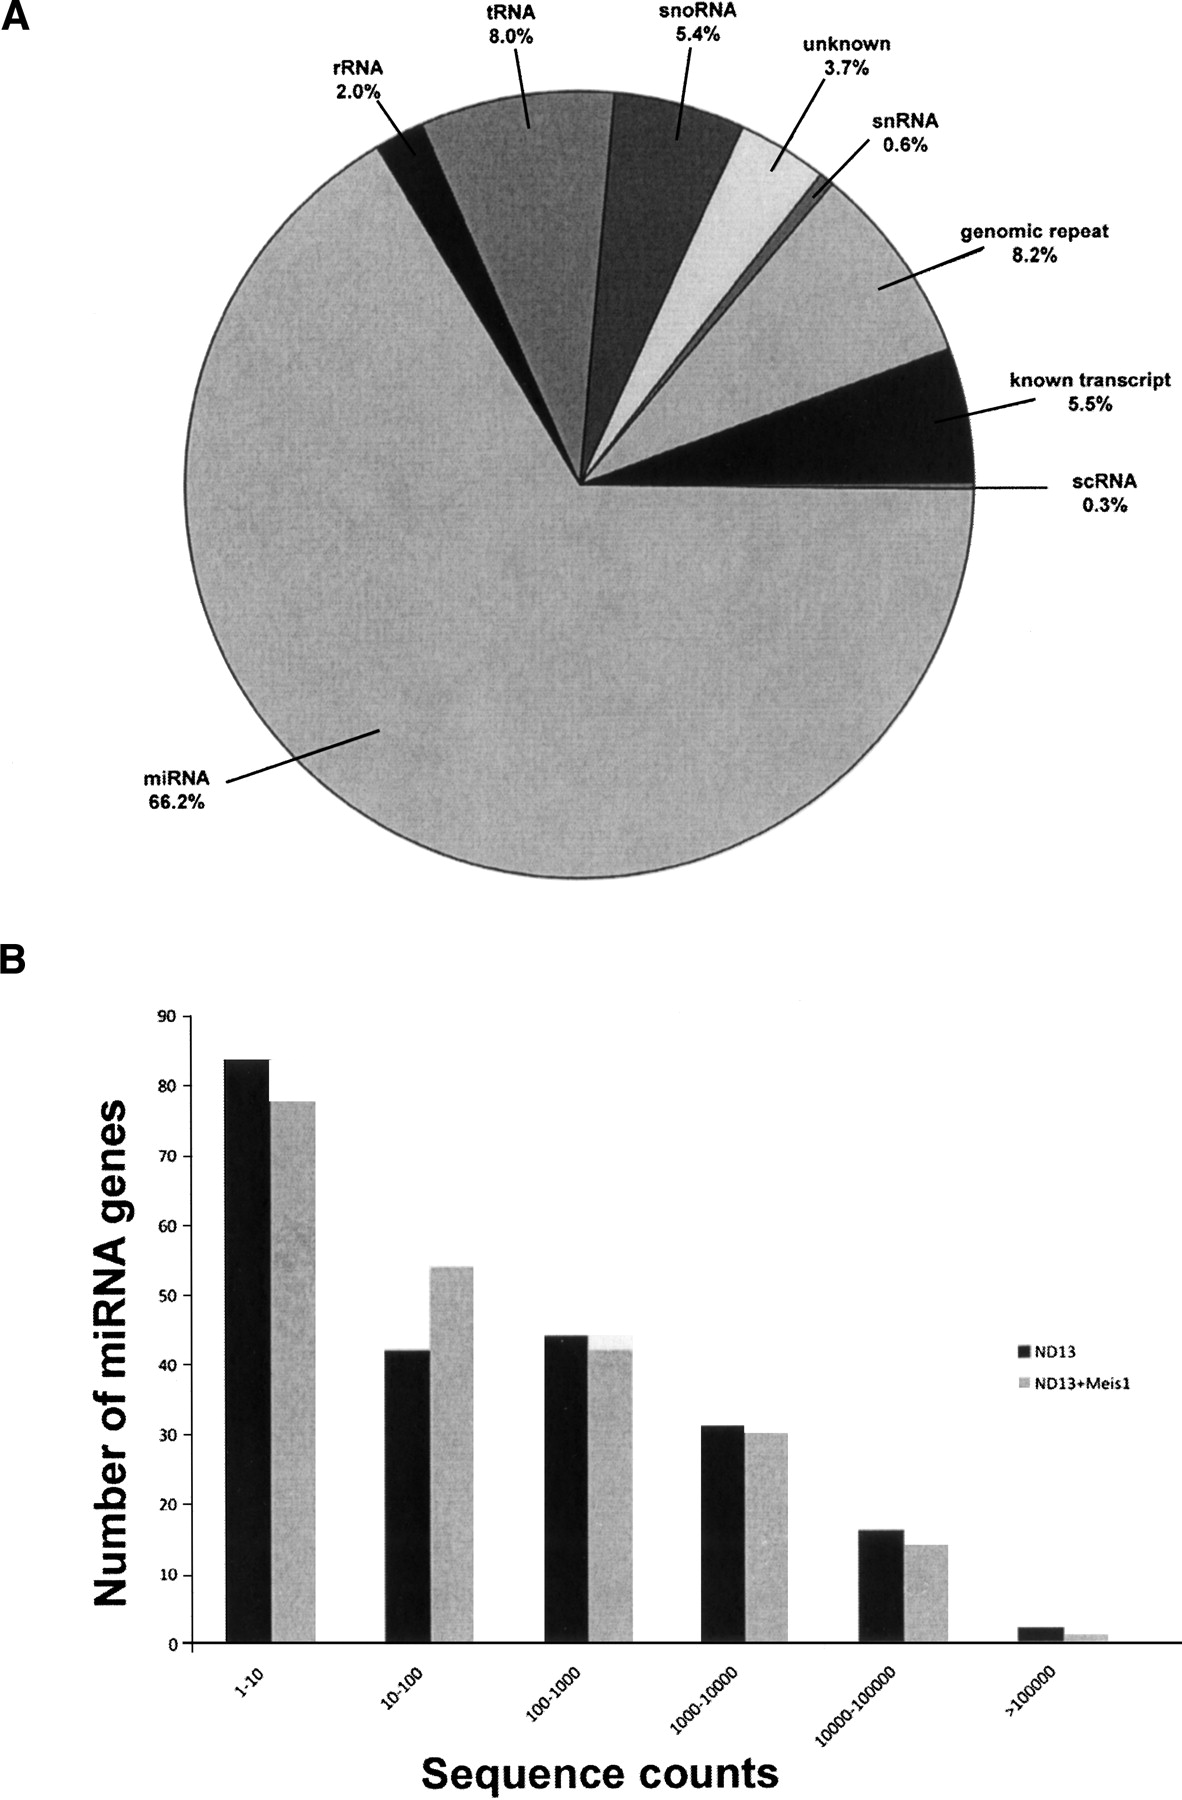
Overview of small RNA and miRNA gene expression in a preleukemic and leukemic cell model obtained by deep sequencing. (A) Breakdown of the proportions (in percent) of various classes of small RNAs detected by sequencing of the preleukemic ND13 library. The percentages are comparable to those found in the leukemic ND13+Meis1 library. Small RNAs belonging to the miRNA family constitute the majority (65.7% in the preleukemic and 66.2% in the leukemic cells). scRNA, small cytoplasmic RNA; snRNA, small nuclear RNA; snoRNA, small nucleolar RNA; rRNA, ribosomal RNA; tRNA, transferRNA; unknown, derived from unannotated/intergenic regions. (B) Distribution of miRNA genes expressed according to their sequence counts in the preleukemic (ND13) compared with leukemic (ND13+Meis1) cells. Shown are the numbers of unique miRNA genes plotted as a function of their expression levels as defined by a given range of sequence counts in the respective libraries of small RNAs. The total numbers of miRNA sequence counts were 1,240,570 and 1,030,414 for the preleukemic and leukemic libraries, respectively.


