
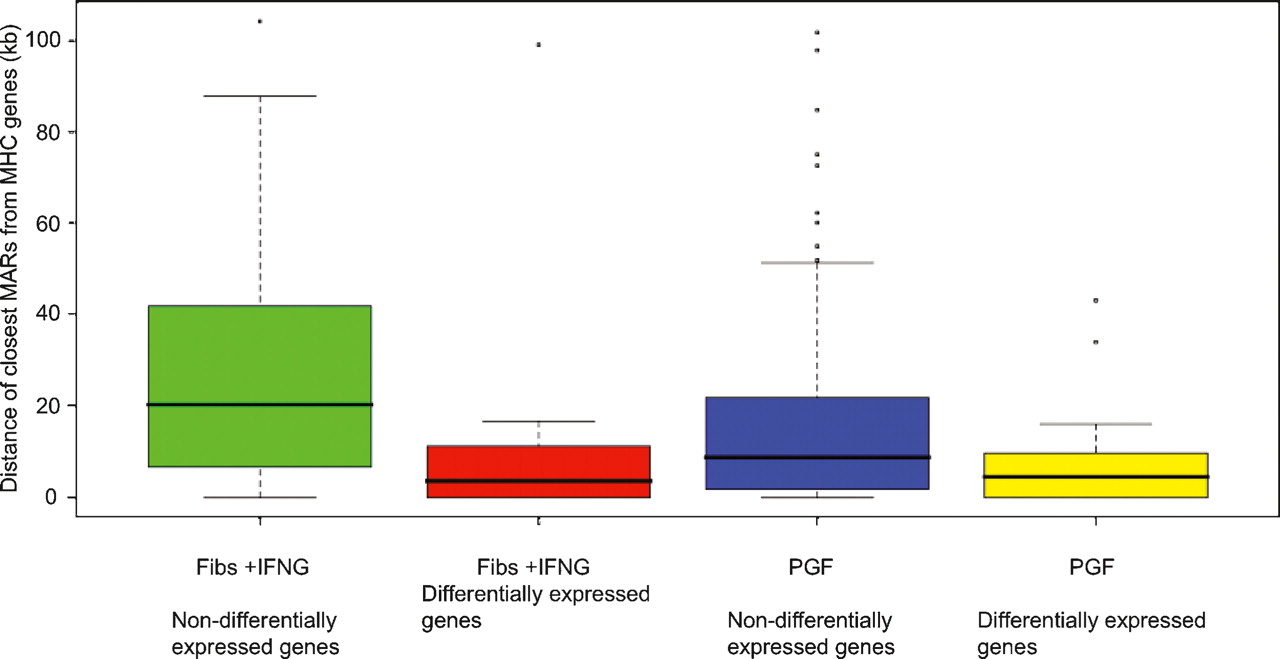
Figure 5.
Distances of MARs to differentially and nondifferentially expressed genes in IFNG-induced fibroblasts and B-lymphoblastoid cells. Boxplots show the interquartile range of the data; the horizontal black lines running through each boxplot represent the median values. The whiskers extend as far as 1.5 times the interquartile range. Any values that lie beyond the whiskers are plotted as dots.


