
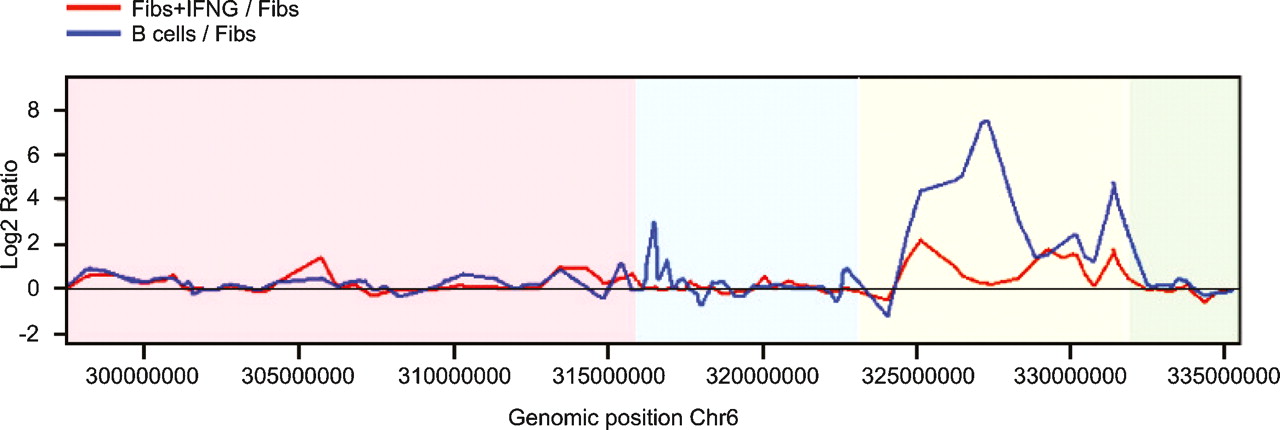
Figure 4.
Comparison of gene expression profiles in the MHC of fibroblasts, IFNG-induced fibroblasts, and B-lymphoblastoid cells. The red line represents the log2 expression ratios of IFNG-induced fibroblast/fibroblast ratios, and the blue line represents the B cell/fibroblast ratios. Color scheme as in Figure 1.


