
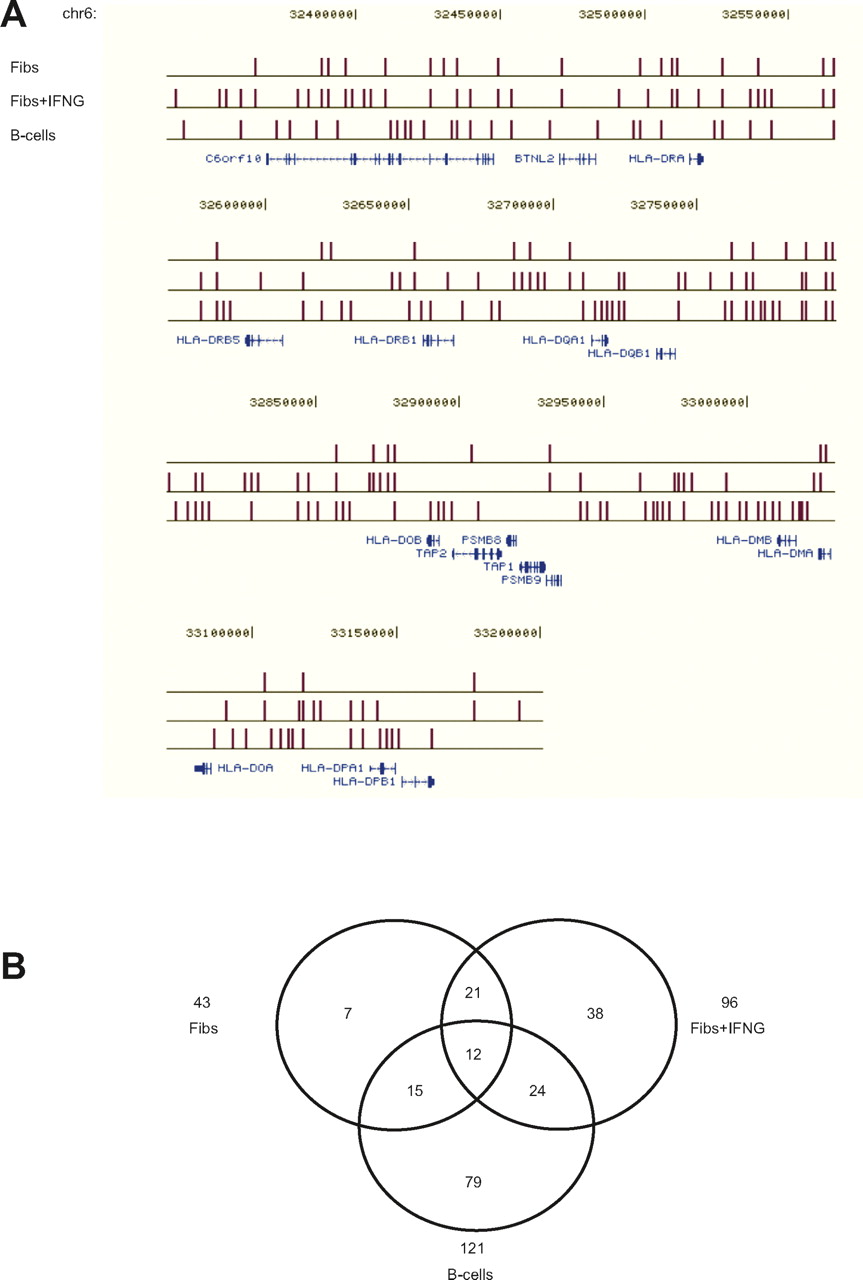
Figure 3.
Comparison of MARs in the MHC class II region in fibroblasts, IFNG-induced fibroblasts, and B-lymphoblastoid cells. (A) MARs are shown relative to RefSeq genes from the UCSC web browser (http://genome.ucsc.edu/). The distribution of MARs across the entire MHC is shown in Supplemental Figure 2. (B) Venn diagram of MARs in the class II region in the different cell types.


