
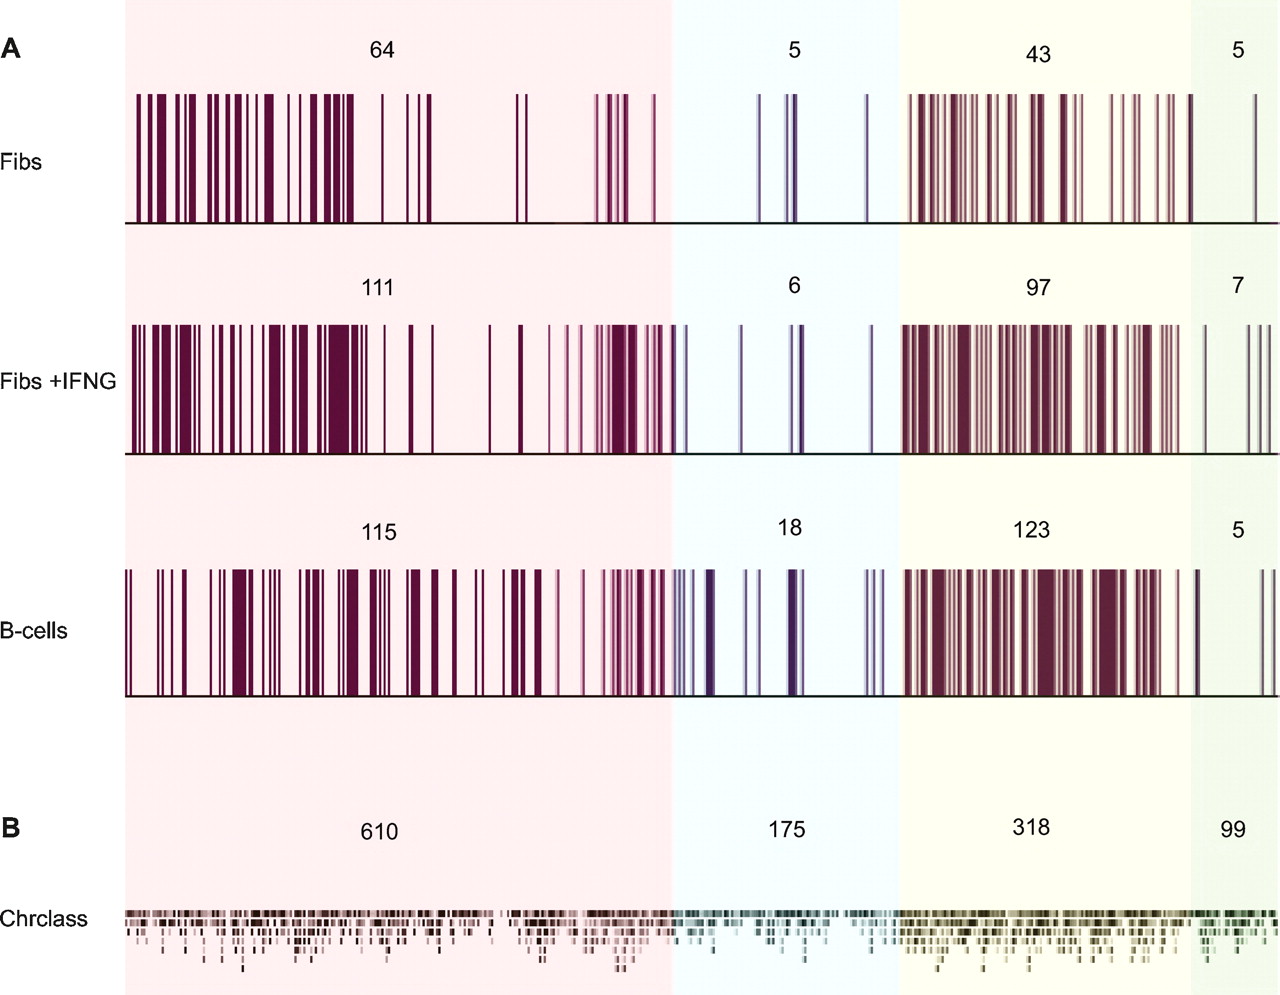
Figure 2.
MARs in the MHC of fibroblasts, IFNG-induced fibroblasts, and B-lymphoblastoid cells. (A) Experimentally identified MARs; (B) predicted MARs using Chrclass. The number of MARs in each region is shown above the data plots. Color scheme as in Figure 1.


