
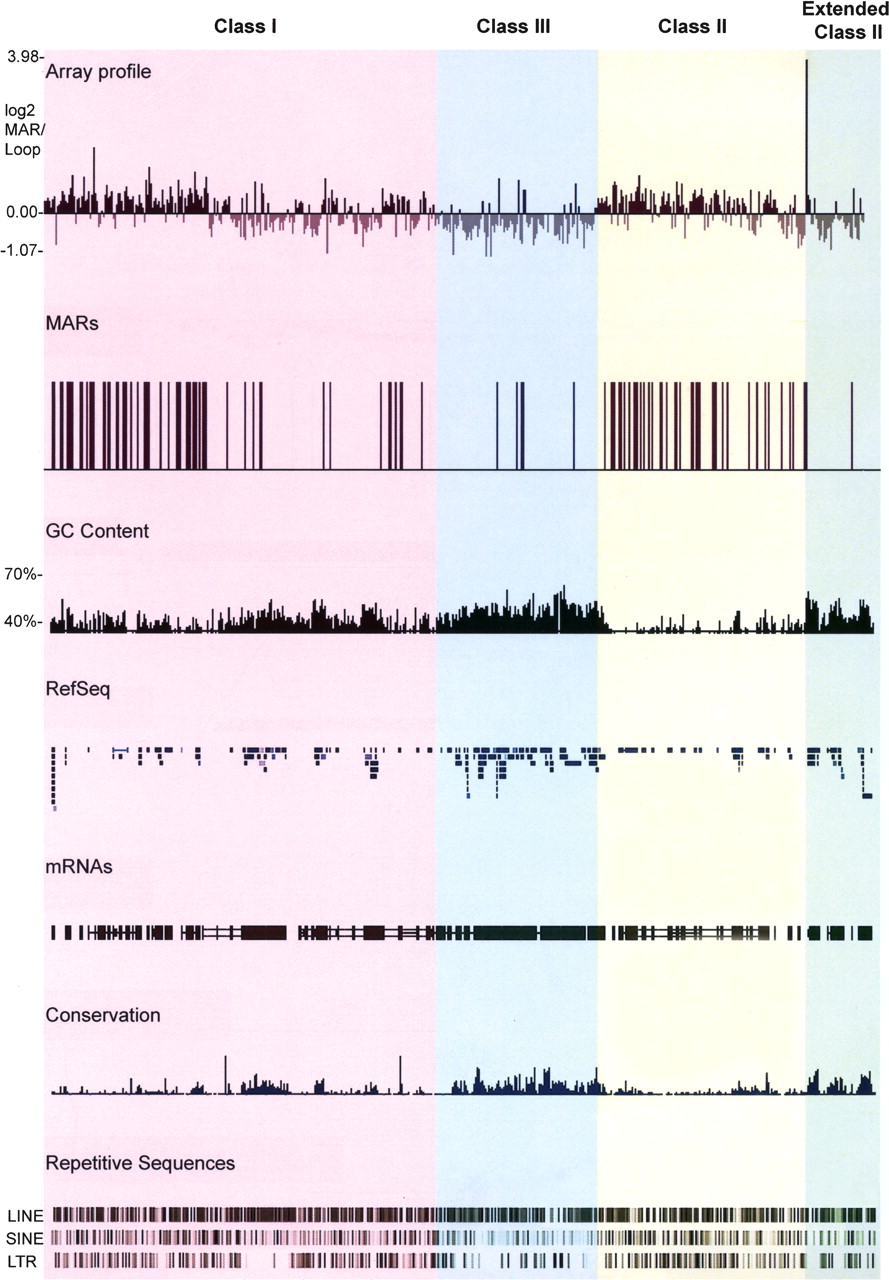
MARs in the MHC of fibroblasts identified using genomic tiling path arrays. MAR and loop DNA fractions were differentially labeled with Cy3 and Cy5 fluorophores and competitively hybridized onto the MHC microarray platform. The log2 ratios of MAR/loop DNA were then calculated and plotted using the UCSC genome database (http://genome.ucsc.edu/). Datapoints with log2 enrichment values > 0.4 were regarded as MARs, plotted on the UCSC genome database, and represented as vertical black bars. The GC content, the RefSeq genes, the human mRNAs from GeneBank, regions of conservation between 17 vertebrate species, and the repetitive sequences LINE, SINE, and LTR across the MHC are shown below the array data. The different regions of the MHC are highlighted in different colors: classical class I, pink; classical class III, blue; classical class II, yellow; and extended class II, green. This color scheme is used in subsequent figures.


