
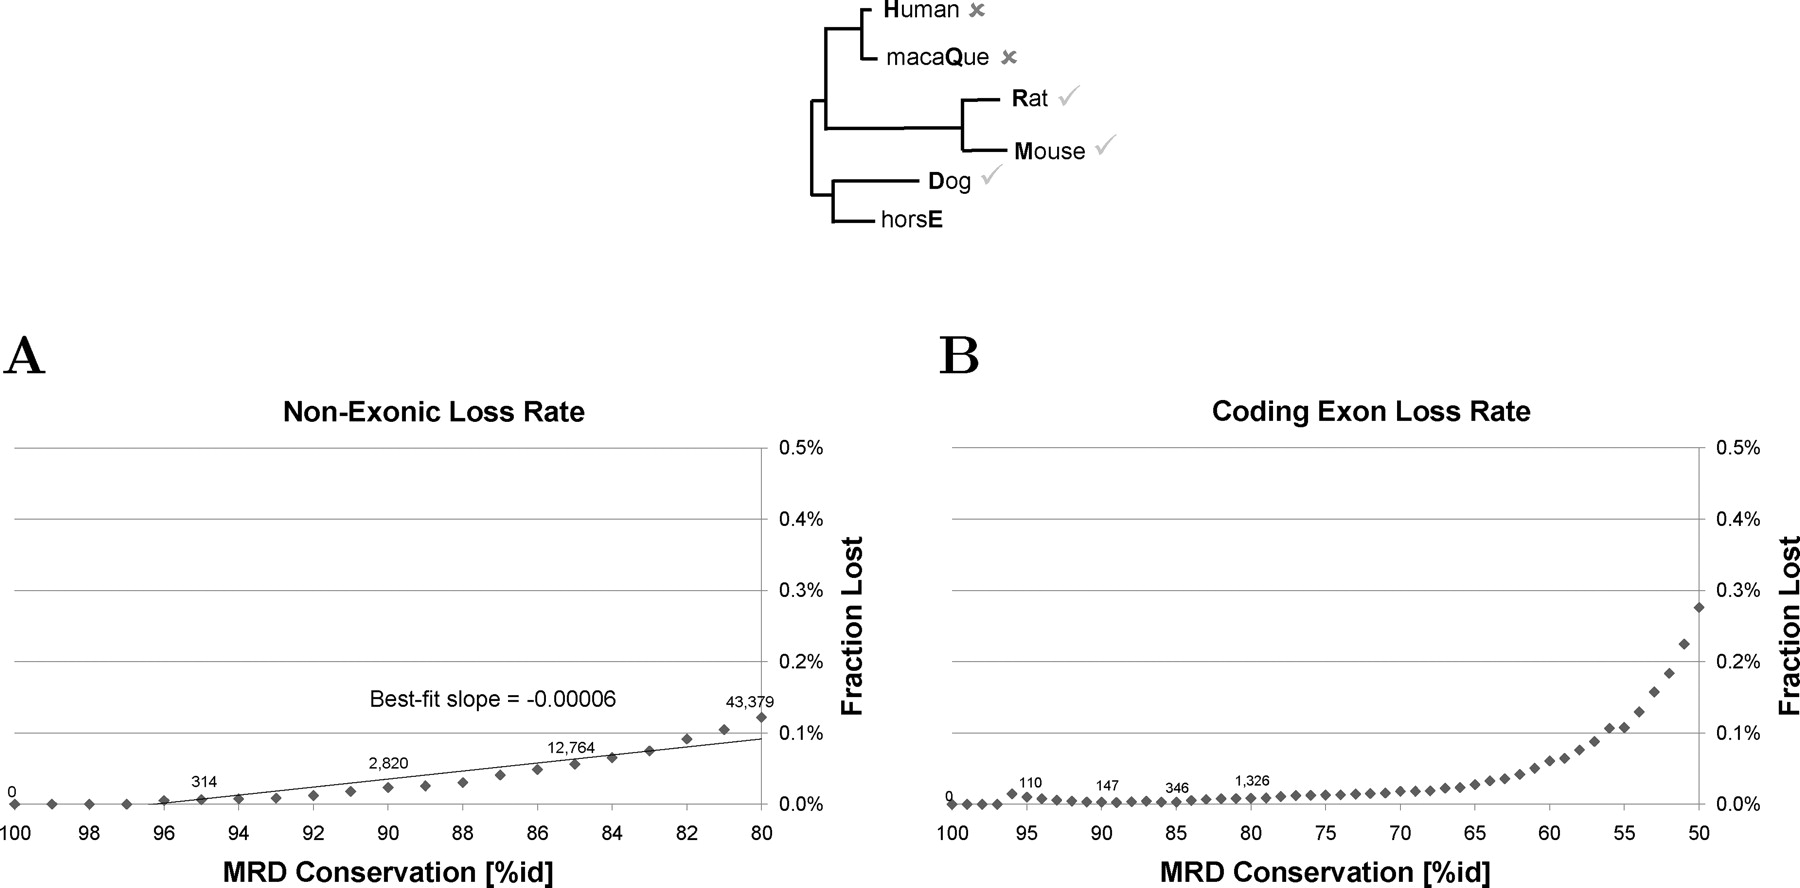
Figure 4.
Functional DNA loss rates. (A) Fraction of rodent-dog nonexonic DNA lost in primates. (B) Fraction of rodent-dog coding exon DNA lost in primates. Total base pairs lost at 100%id, 95%id, 90%id, 85%id, and 80%id displayed above corresponding loss rate points. Note the scale change on the x-axis.


