
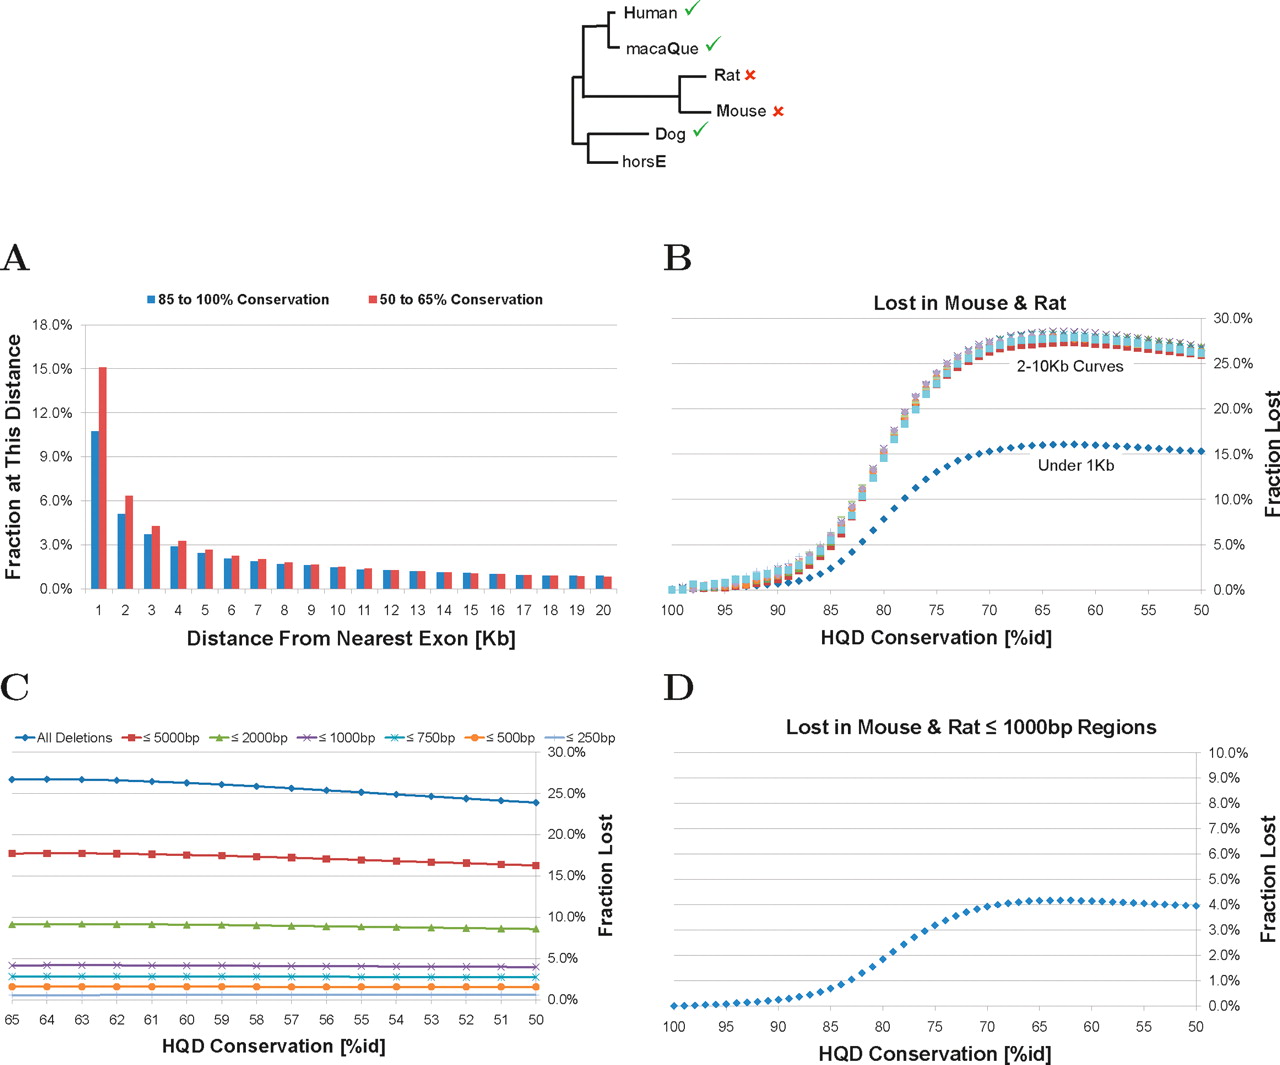
Figure 2.
Relationship of neutrally-evolving mammalian DNA loss rates to mammalian genome structure. (A) Fraction of conserved nonexonic primate-dog elements as a function of distance from nearest exon. (B) Rodent-specific loss rate of nonexonic elements as a function of distance from the nearest exon. Elements within 1 kb of the nearest exon are markedly less likely to be lost at all conservation levels. (C) Rodent-specific loss rate of low-conservation nonexonic regions as a function of lost region size. (D) Rodent-specific loss rate of nonexonic regions at most 1000 bp in size.


