
Properties of CNV and CNVR sets for Nijmegen, Wong et al., Redon et al. Affymetrix, and Redon et al. aCGH data
Click on table to view larger version.
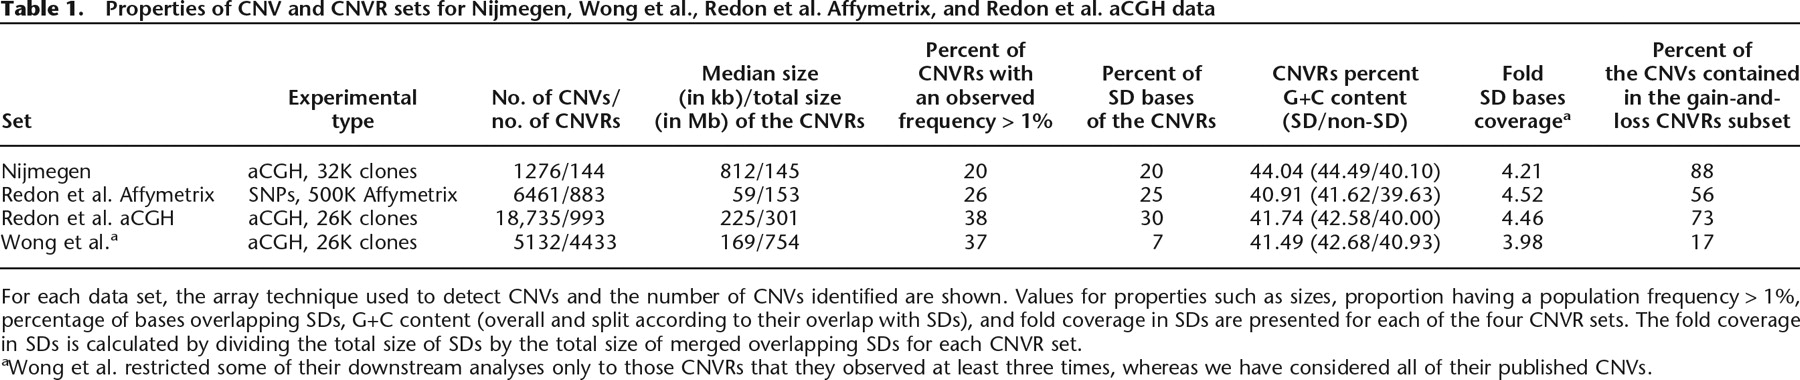
For each data set, the array technique used to detect CNVs and the number of CNVs identified are shown. Values for properties such as sizes, proportion having a population frequency > 1%, percentage of bases overlapping SDs, G+C content (overall and split according to their overlap with SDs), and fold coverage in SDs are presented for each of the four CNVR sets. The fold coverage in SDs is calculated by dividing the total size of SDs by the total size of merged overlapping SDs for each CNVR set.
aWong et al. restricted some of their downstream analyses only to those CNVRs that they observed at least three times, whereas we have considered all of their published CNVs.


